41 Product Management KPIs You Can’t Afford To Ignore In 2023
Product management KPIs are key performance indicators that show your product strategy, development, and marketing success. Optimisation is the key to the game, and utilising these indicators will help your product managers keep track of your business goals.
Knowing the key metrics aids in product improvement. These help you easily communicate and find areas for improvement regarding your product vision and proposition.
This article will teach you how to use 41 product management KPIs to measure your product’s performance in 2023.
Table of Contents
- What are key product management metrics and KPIs?
- Business performance KPIs to track by product managers
- How do I set up KPIs for product management?
- How to choose the right KPIs for your product
- Conclusion
- Machine Learning In Finance: 12 Essential Applications
- How To Create Interactive Compliance Training For Bank Employees
- How Fintech Apps Are Using Gamification To Increase User Engagement
- Top Gamification Companies for Employee & Customer Engagement
What are key product management metrics and KPIs?
Product management metrics are vital for optimising your product’s performance and maximising its value for your customers and your business. They are numerical indicators of your product’s efficacy and impact, covering customer acquisition, satisfaction, behaviour, and engagement.
They also give you insight into your product’s quality, reliability, and profitability. These metrics are great for monitoring your product’s progress and detecting areas that need improvement.
They are indispensable for assessing your product’s success and aligning it with your business objectives.
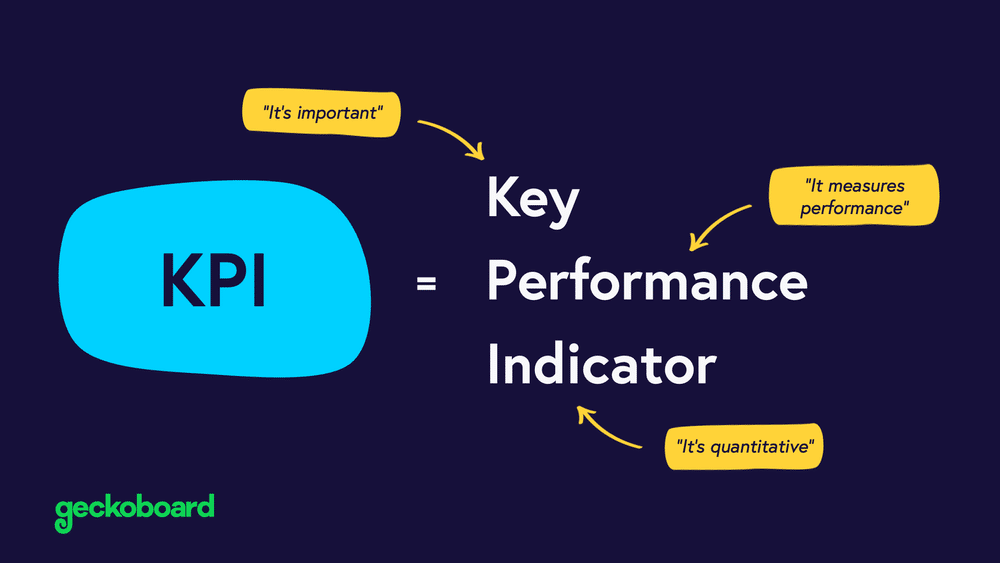
One example of a product management metric is Key Performance Indicator or KPI. KPIs are a subset of metrics focusing on your product strategy’s key objectives and outcomes.
Keep in mind that all of these should be specific, measurable, achievable, relevant, and time-bound (SMART) targets that align with your product vision and mission.

Source: Geckoboard
Business performance KPIs to track by product managers
Choosing the right metrics and KPIs to track in different areas of your business helps you prioritise the critical aspects of your product development. Here are the product management KPIs to monitor in various areas of your business.
Product Development KPIs
Product development KPIs reveal how proficiently you are crafting your product. They demonstrate how much value your product features and functionality deliver to your customers and users.
These KPIs also assist you in identifying any issues, impediments, or prospects for improvement in your product development cycle.
Some examples of product development KPIs are:
#1. Time to Market (TTM)
Time to market is the duration from the initial idea to the launch of a new or improved product. TTM indicates how swiftly you can market your product and satisfy customer demand.
#2. Product Development Cycle Time
Product development cycle time refers to the duration you allocate to a particular phase. It is the stage of your product development process, from initiation to culmination.
This is utilised to evaluate how effectively you can perform your product development endeavours, such as strategising, designing, verifying, and launching.
#3. Product Quality
Product quality is about how well your product meets or exceeds customer expectations and requirements. Product quality indicates how well you can deliver a reliable, usable, secure, and scalable product.
#4. Innovation Rate
The percentage of revenue or profit that comes from new or improved products. The innovation rate in ROI reveals how profitable your product development initiatives are relative to average revenue per user and their costs.
Dictates how well you can create value for your customers and users through novel or enhanced solutions.
#5. Resource Utilisation
The ratio of actual resources used to planned resources allocated for a project or activity. Resource utilisation indicates how effectively you can manage your human, financial, technical, and material resources in product development.
#6. R&D Investment as a Percentage of Revenue
This product development KPI indicates the proportion of your revenue you allocate to investigating and devising innovative or augmented products.
It reveals how much you spend on improving your merchandise about your income. The ratio of R&D expenses to total revenue serves as the equation.
#7. New Product Revenue
The amount of revenue generated by new or improved products within a given period. New product revenue reveals how successful you are in monetising your innovation efforts.
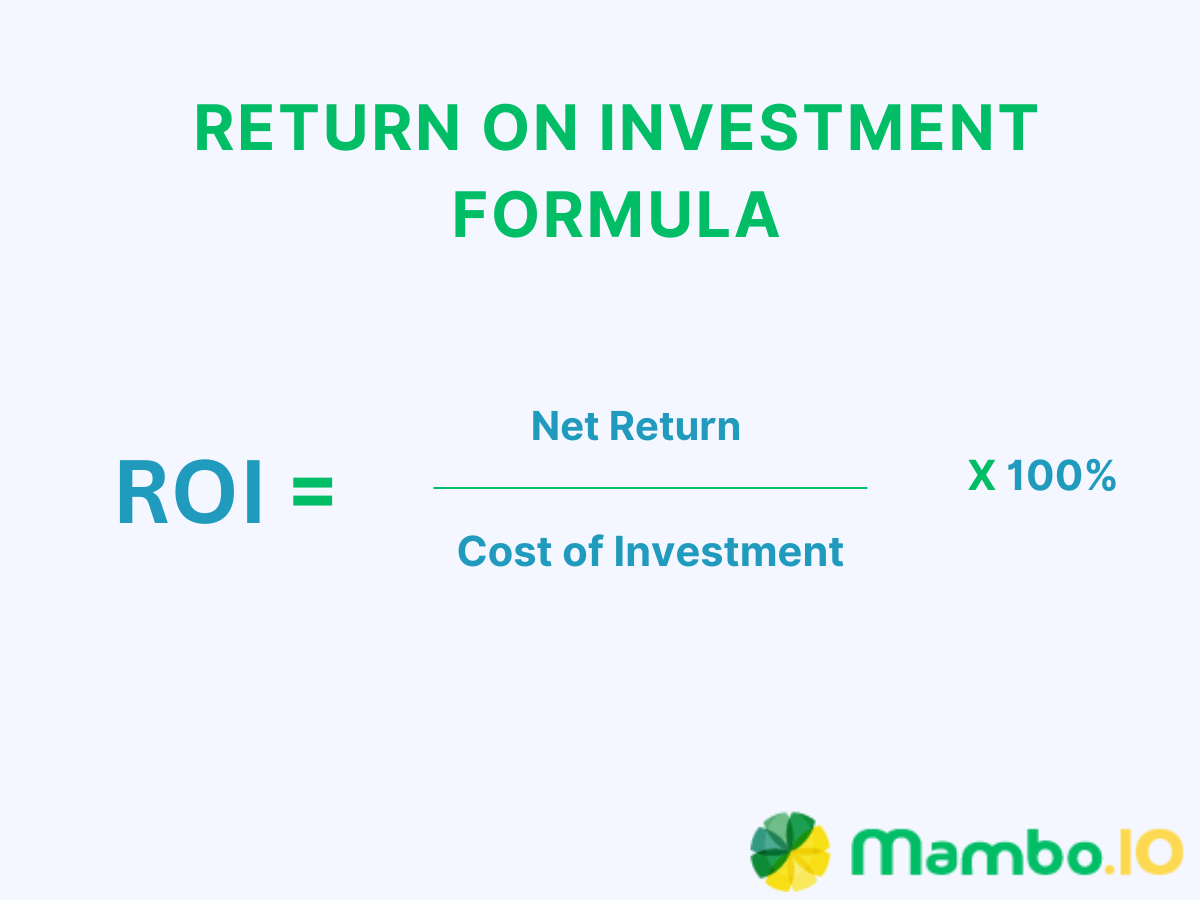
#8. Return on Investment (ROI)
The ratio of net profit to total investment for a project or activity.
#9. Customer Feedback and Engagement
This is the quantity and calibre of feedback and engagement from customers and users about your product attributes and functionality.
Customer feedback and customer engagement reveal how content and faithful your customers are. How many customers do you have for your product? As well as how much they contribute to your product enhancement and innovation.
#10. Product Adoption Rate
The percentage of customers or users who adopt or use your product within a given period. Product adoption rate reveals how well you can attract new customers and retain customers and users for your product.
#11. Product Performance
Product performance reveals how well your product operates and delivers value to your customers. It measures the functions of the product, such as reliability, usability, and scalability.
#12. Market Share
The percentage of your product’s total sales or customers in a given market or segment. Market share reveals how competitive and dominant your product is in the market.
#13. Customer Lifetime Value (CLV)
Customer lifetime value reveals how valuable and loyal your customers are to your product. It is the total net profit you expect to generate from a customer over their entire relationship with your product.
#14. New Products Releases
The number of new or improved products you launch within a given period. New products released reveal your productivity and innovation in creating value for your customers and users.
Product Marketing KPIs
Product marketing KPIs evaluate the efficiency and impact of your product marketing strategy. These metrics determine how successful the marketing team is at creating awareness and interest in your product.
It also helps transform prospects into buyers. Product marketing KPIs can also identify the optimal channels, messages, and tactics for reaching and engaging your target audience.
Some examples of product marketing KPIs are:
#1. Product Awareness
Product awareness determines the number of potential customers aware of your product’s benefits. It measures how well you can create market interest and demand for your product.
#2. Lead Generation
The number of potential customers or users who express interest in your product by providing their contact information or taking a desired action. Lead generation gauges how well you can attract and capture prospects for your product.
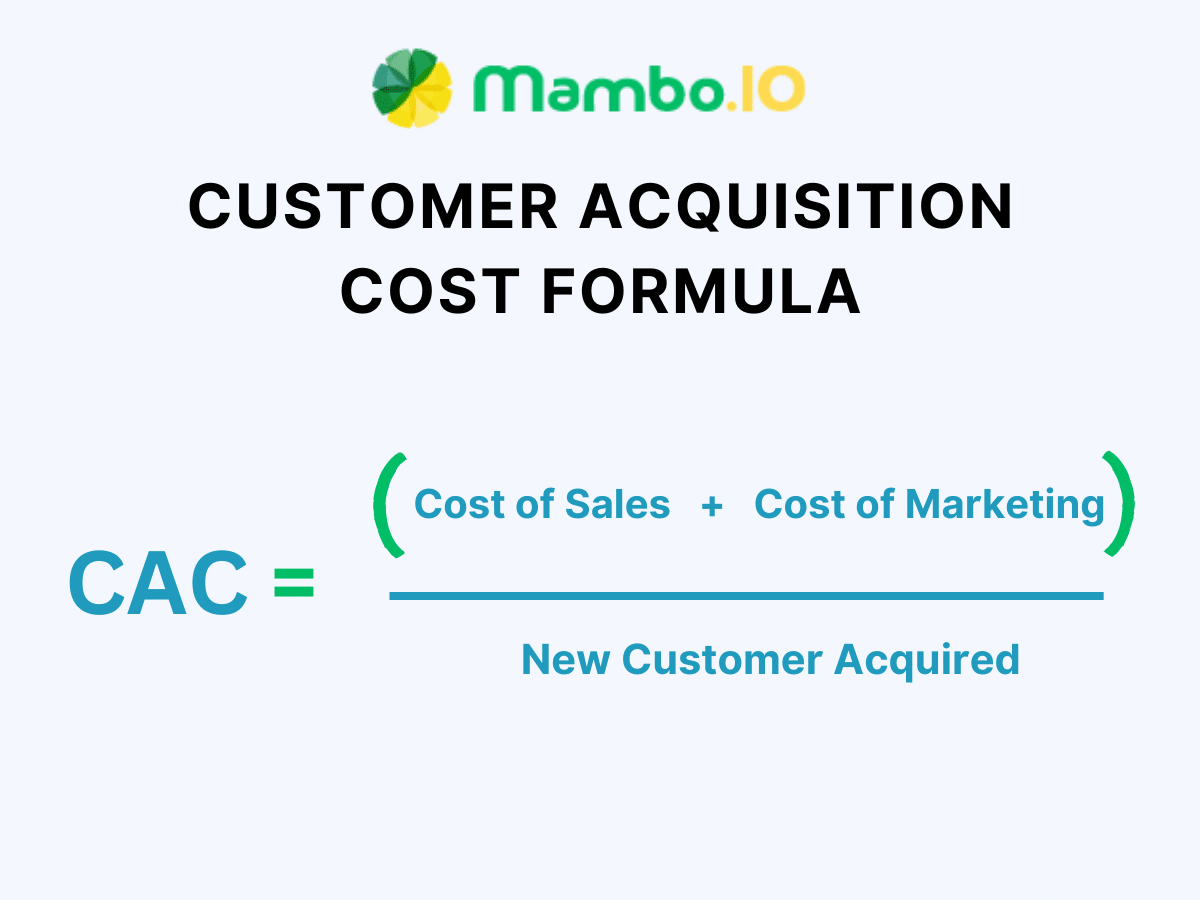
#3. Customer Acquisition Cost (CAC)

Customer acquisition cost gauges how efficiently you can convert leads into customers for your product. The total customer acquisition cost is all the expenses you incur in marketing, sales, and other activities to acquire a new customer.
#4. Customer Conversion Rate
The percentage of leads who become customers within a given period. The customer conversion rate will help you with your acquisition costs and gauges how effectively you can persuade and close prospects for your product.
#5. Sales Revenue
The income generated by selling your product within a given period, or monthly recurring revenue, is termed sales revenue. The proficiency of your product in producing money in the market is gauged by sales revenue.
#6. Return on Investment (ROI)

ROI gauges how profitable your product marketing initiatives are relative to their costs. The ratio of net profit to total investment for a project or activity.
#7. Customer Retention Rate
The percentage of customers who remain loyal to your product within a given period.
Customer retention rate increases active users and gauges how well you can keep and satisfy existing customers. It is also to track the rate of customer satisfaction for your product.
#8. Customer Lifetime Value (CLV)
The total net profit you expect to generate from a customer over their entire relationship with your product. CLV measures how valuable and faithful your customers are to your product.
CLV is also a product development KPI but has a different perspective on product marketing.
In product marketing, CLV helps you determine how much you can spend on acquiring and retaining customers. It also illustrates how to segment and target them based on their value.
#9. Product Messaging Effectiveness
The degree to which your product messages resonate with your target audience and influence their behaviour. Product messaging effectiveness gauges how well you can communicate your product’s value proposition and differentiation in the market.
#10. Content Engagement
Content engagement is the quality of engagement from your customers regarding your content. You can measure engagement using the analytics from your blogs, videos, or social media posts.
It determines how well you can educate and entertain your audience with relevant and valuable content.
#11. Marketing Qualified Leads (MQLs)
The number of leads who meet certain criteria based on their behaviour or profile indicates their readiness to buy your product. MQLs measure how well you can qualify and prioritise prospects for your product.
#12. Sales Qualified Leads (SQLs)
SQLs evaluate how well you can transfer prospects from marketing to sales for your product. The number of leads who meet certain criteria based on their behaviour or profile that indicate their interest in buying your product.
#13. Customer Feedback and Sentiment
The amount and quality of feedback and sentiment from potential or existing customers regarding your product marketing efforts. This is done through campaigns, events, promotions, etc.
Customer feedback and sentiment gauge how satisfied and loyal your customers or users are. It measures their contribution to your product’s marketing improvement and innovation.
#14. Market Share
The percentage of your product’s total sales or customers in a given market or segment. Market share measures how competitive and dominant your product is in the market.
#15. Competitive Positioning
Competitive positioning is how well you position your product in the market with its features and benefits. The price, quality, and customer experience are also factors to consider.
#16. Customer Advocacy and Referrals
The number and percentage of customers or users who recommend your product to others or act as your brand ambassadors.
Customer advocacy and referrals measure how well you can leverage word-of-mouth marketing and social proof for your product.
#17. Channel Performance
The effectiveness of each marketing channel is used to measure the marketing performance. You can use the analytics from email campaigns, social media, or websites to promote and distribute the product.
It measures how well you can optimise your marketing mix and budget for your product.
#18. Customer Onboarding and Activation
The process and outcome of introducing new customers or users to your product and helping them achieve their first value or success.
Customer onboarding and activation measure how well you can reduce friction and increase retention for your product.
Sales KPIs
Sales KPIs measure the performance of your sales team. These metrics can help you improve your sales results by monitoring the loss and profit of your product.
Profit is often measured through financial KPIs. However, sales KPIs use non-financial data to understand the sales process better.
The product management KPIs for sales help enhance your sales pipeline and resources. You can also employ them to ascertain which sales strategies, tactics, and techniques work best for selling your product.
Some examples of sales KPIs are:
#1. Revenue per Sales Rep
The amount of revenue generated by each sales representative within a given period. Revenue per sales rep measures how productive and effective each salesperson is in selling your product.
#2. Average Deal Size
The average amount of revenue generated by each closed deal within a given period. The average revenue per deal size measures how profitable each sale is for your product.
#3. Sales Volume
Sales volume is the number of units sold, or subscriptions availed within a given timeframe. It defines the popularity and demand of your product on the market.
#4. Sales Growth
Sales volume is the number of units sold, or subscriptions availed within a given timeframe. It explains the popularity and demand of your product on the market.
#5. Sales Cycle Length
The average time it takes from the first contact with a lead to the closing of a deal.
Sales cycle length measures how efficiently you can move prospects through your sales funnel for your product.
#6. Lead Conversion Rate
The percentage of leads who become customers within a given period.
Lead conversion rate measures product success by effectively persuading and closing prospects for your product. It will evaluate your company’s customer success and customer effort score.
#7. Quota Attainment
The percentage of sales representatives who meet or exceed their sales quota within a given period.
Quota attainment measures how well you can set and achieve realistic and challenging sales goals for your product. It will aid in the increase of the monthly recurring revenue.
#8. Customer Retention Rate
Usually tracked for product marketing KPI – this can also be considered a sales KPI.
The percentage of customers who stay loyal to your product within a given period will increase the monthly recurring revenue and the average revenue per user.
#9. Customer Churn Rate
The percentage of active users and customers who stop buying or using your product within a given period.
Customer churn rate measures how well you can prevent customer churn, attrition, and the loss of customers for your product.
How do I set up KPIs for product management?
Setting up KPIs for your product management is a task that takes time to complete. It is an ongoing process that requires strategising, implementing, observing, and assessing. To set up KPIs for product management, product managers can follow these steps:
Use SMART criteria for setting KPI targets
As mentioned earlier, KPIs should be SMART: specific, measurable, achievable, relevant, and time-bound. To make your KPIs SMART, you should define them clearly and precisely.
- Use quantifiable metrics to measure them.
- Set realistic and attainable targets.
- Align them with your product goals and objectives.
- Specify a deadline or timeframe for achieving them.
A SMART way of saying “I want to increase customer satisfaction score” would be “I want to increase the average customer lifetime and customer satisfaction score (CSAT) by 10% in the next quarter”.
Establish a cadence for tracking and reporting KPIs
After setting up your KPIs, you must track them regularly and report them to your product management teams and stakeholders.
Deciding on a cadence or frequency for tracking and reporting KPIs that match your product stage and lifecycle is essential. This is to meet your stakeholder’s expectations and needs.
You can assess how often you need to track and report your KPIs by:
- Looking at how urgent and important your product goals and objectives are.
- The intervals are flexible, and you can do them daily to yearly.
- Always use appropriate tools and methods for tracking and reporting KPIs. Use dashboards, charts, graphs, and tables to present your metrics.
- KPIs should be visible and accessible to your team and stakeholders and easy to understand and interpret.
Communicate KPIs and progress to stakeholders.
Tracking and reporting KPIs need to be improved; you must also communicate the progress to your stakeholders.
Discuss the customers, users, executives, investors, partners, etc. Make them understand the meaning and importance of your KPIs and the results and outcomes that they demonstrate.
A highly imperative task that you must do is to:
- Accentuate the achievements and successes that you have made with your KPIs.
- Include the challenges and issues that you have met or are meeting.
- Just be mindful that you must provide recommendations and action plans.
- Solicit feedback and suggestions from customers and your stakeholders to improve or maintain your performance.
How to choose the right KPIs for your product
Selecting KPIs for your product manager or team can be a complex and challenging task. There is no universal or standard way of choosing KPIs for product management.
However, you can follow some general guidelines and best practices to pick the right KPIs for your product:
Identify business objectives and goals
Before selecting KPIs for your product, you need to establish your business objectives and goals.
How do you define your product’s success? How do you intend to add value and satisfy your customers and users?
Your KPIs should align with and support your business objectives and goals.
Prioritise KPIs based on business impact and feasibility
The next step in choosing KPIs for your product is to prioritise them based on their business impact and feasibility.
How important and urgent are each of your KPIs? What is the value and benefit of each potential KPI for your business? How easy or difficult are they to measure and achieve?
Focus on the most impactful and feasible KPIs and balance them across different aspects of your product’s performance.
Consider data availability and accuracy
Ensure your data is available and accurate when choosing KPIs to measure your product.
Check what sources and tools you can use to track the metrics correctly. How reliable and valid are they?
You should select KPIs that you can measure accurately and consistently with the data you have or can obtain. You should also validate and verify your data’s quality and integrity regularly.
Align KPIs with team and individual goals
The final step in choosing your product’s KPIs is aligning them with your team and individual goals.
How do your KPIs relate to the purposes of your team members and yourself? How do they motivate and inspire them to perform better?
You should choose KPIs that foster collaboration and accountability among your team members and reflect their roles and responsibilities.
Conclusion
Product management KPIs measure and improve your product’s performance. They track your progress, identify improvement areas, and communicate your product vision and value.
Knowing the 41 different types of product management KPIs can help you evaluate and enhance your product manager’s performance in 2023.
With Mambo, you can encourage the use of your product and increase business KPIs in a fun and gamified way.
It is an enterprise gamification platform that can help you with product development and implement gamification strategies for your business. Mambo is flexible, feature-packed, customisable, and tailored to meet your requirements.
Request a demo today and see how Mambo can help you create next-generation solutions for your product management challenges!
Download your free
“Gamification Guide”
Get your PDF now and start transforming your approach to digital engagement!
Latest Posts
Machine Learning In Finance: 12 Essential Applications
The impact of machine learning on finance is significant. Thanks to this technology, financial institutions are now equipped to make efficient decisions. Through the analysis of data sets, machine learning […]
How To Create Interactive Compliance Training For Bank Employees
Banking compliance training isn’t just another task. It’s the stage where everything else performs. Banks must navigate a myriad of regulations and laws. After all, this is a trust-driven, high-stakes […]
How Fintech Apps Are Using Gamification To Increase User Engagement
Discover how gamification in fintech is revolutionizing financial engagement, making banking fun & boosting user loyalty.


