5 Most Important User Engagement Metrics To Track In 2023
In today’s ever-evolving business landscape, identifying and keeping track of user engagement metrics has become more important. These metrics tell the story of how customers are engaging with your product or service. This helps you make data-driven decisions to drive better results.
This article explores the top five user engagement metrics you should prioritise tracking in 2023. By leveraging these metrics, you can gain valuable insights into user behaviour and optimise user experience for improved business growth.
Table of Contents
- What is user engagement?
- Key user engagement metrics to measure
- Take advantage of gamification to increase user engagement
- Conclusion
- Machine Learning In Finance: 12 Essential Applications
- How To Create Interactive Compliance Training For Bank Employees
- How Fintech Apps Are Using Gamification To Increase User Engagement
- Top Gamification Companies for Employee & Customer Engagement
What is user engagement?
Put simply, user engagement refers to how well users interact and are involved with a product, service, or platform.
These interactions can be defined by various actions taken by users at different stages of the customer journey. Examples include clicking, commenting, buying, sharing, liking, advocating, or completing any other desired actions indicated by your Call To Action (CTA).
User engagement can also be defined by users’ emotional connection and involvement with a product or service. These actions generally stem from emotional investment in a product or service. For example, user engagement for an e-commerce store might include repeat purchase rates, positive reviews, and referrals.
Lastly, we can view user engagement as the time a user spends on a product or service. The more time they spend, the higher the level of user engagement. For example, a news website might measure user engagement based on the time spent reading articles.
Achieving high user engagement is essential because it directly impacts customer satisfaction, retention, and revenue. After all, engaged users are more likely to purchase a product, convert it into repeat customers, and even become brand advocates.
Why does measuring user engagement metrics matter?
Tracking user engagement metrics is crucial for optimising your marketing efforts. By taking the time to analyse how users interact with a product, businesses can better understand their target audiences and deliver tailored customer experiences. This can facilitate data-driven decisions that lead to happier, more active customers.
Download your free
“Gamification Guide”
Get your PDF now and start transforming your approach to digital engagement!
Key user engagement metrics to measure
Here are five important engagement metrics your business should track in 2023.
#1. User Activation Rate
User activation rate refers to the percentage of users who complete the onboarding process or start using a product or service.
With user activation rate, you’re tracking a set milestone in the onboarding process or soon after the user’s first experience with the product. Of course, this milestone will vary from one business to the other. For instance, a social media app might track how many users have completed their profiles upon signup. A streaming platform might set a milestone to look at how many users have created their first playlist.
In any case, the user activation rate is one of the most essential user engagement metrics to measure. It gives you an idea of how well your product or service can capture and retain users’ attention. With the proper milestones, you can create a trail of valuable data points along the user journey to refine your marketing strategy.
How to calculate user activation rate
Calculating user activation rate is generally straightforward. The important thing is to know what milestone you are tracking. Divide the number of users who have reached that milestone by the number of users onboard. Then multiply by 100.

A high user activation rate indicates that users are successfully onboarded and finding value in the product or service. This can improve user retention, customer loyalty, and competitive advantages.
On the other hand, a low user activation rate may suggest that users need help getting started. Left unchecked, this can lead to drop-offs, churn, and many missed opportunities.
Simplifying the onboarding process is key to improving the user activation rate. Basically, shorten the steps required for users to get started with your product. Tailoring the user experience by highlighting your product’s key features or functionalities that directly address their pain points is essential.
#2. Time on Page
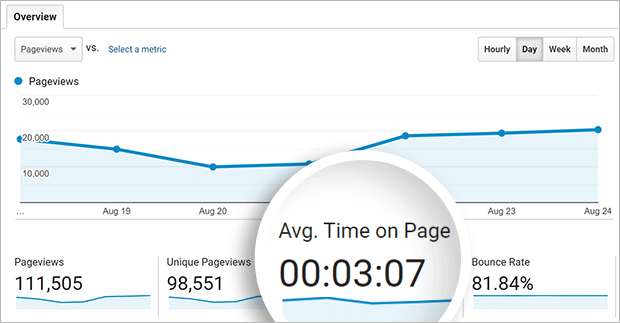
If your company has a business website (and it should), time on page is one of the most important engagement metrics you’ll need to monitor. As the name implies, this metric is about a user’s time on a specific web page before navigating away.
A longer time on the page is a good sign that users are actively engaging with the content on that page. This makes them more likely to respond positively to your CTA. If the time spent on the page is low, chances are the visitor didn’t find the page helpful and moved away. This dramatically increases the bounce rate.
One of the simplest ways to track time on a page is through website analytics tools, such as Google Analytics or Kissmetrics. These tools monitor user interactions on each webpage, including what they click on and how long they spend.

Keep in mind that average time on page benchmarks may vary. Consider the type of content on the page and the industry in which your business operates.
For example, a 1000-word blog post may have an average time on a page of 4-5 minutes. A product page featuring short descriptions may have a faster average time of 30 seconds to 1 minute on the page.
Still, comparing your website’s time-on-page metrics with industry benchmarks can be a great way to identify areas for improvement. This way, you can make data-driven decisions to optimise the page for higher user engagement.
Tips for improving user time on page
- Improve web content quality — Ensure the content is concise and relevant to the user.
- Optimise page layout and design — Present the content clearly and visually appealingly.
- Enhance CTAs — Make sure the CTA is prominent on the page and is aligned with the user’s intent.
- Use multimedia content strategically — Video, image, and interactive elements can be great for capturing users’ attention, which can translate to improved user engagement.
#3. User Activity
This user engagement metric measures the level of user interaction over a given period. It tracks the number of unique visitors actively using a product within a given temporal window — daily, weekly, and monthly.
- Daily Active Users (DAU) — DAU measures how many unique users engage with a product daily. This helps provide insights into the daily usage patterns and frequency of user activity.
- Weekly Active Users (WAU) — WAU measures user activity weekly. This provides a broader view over a more extended period and helps businesses understand user engagement trends.
- Monthly Active Users (MAU) — As the name suggests, MAU looks at user activity monthly. This provides a high-level overview of user engagement, which your business can use to track long-term customer retention and growth.
Before measuring user activity, you must define what qualifies as an “active user” event. Is it when they open a specific page or log in to their account? Or is it when they interact with a particular feature? This makes it easier for the marketing team to accurately track many daily, weekly, or monthly active users you have.
Optimising your product for improved user activity
If your business is recording low active users, it could indicate they’re not getting much value from your product. It could also indicate they’re having difficulty using the product.
Enhancing product features is a great place to start. Analyse user activity data to identify the most frequently used and underutilised parts. The production team can prioritise the right feature enhancements or updates for better user engagement.
Another great idea is to optimise the look and feel of the site. Streamline the UI design so users can access and interact with the product in the simplest way possible. This can improve user satisfaction and encourage higher customer engagement.
#4. Bounce Rate
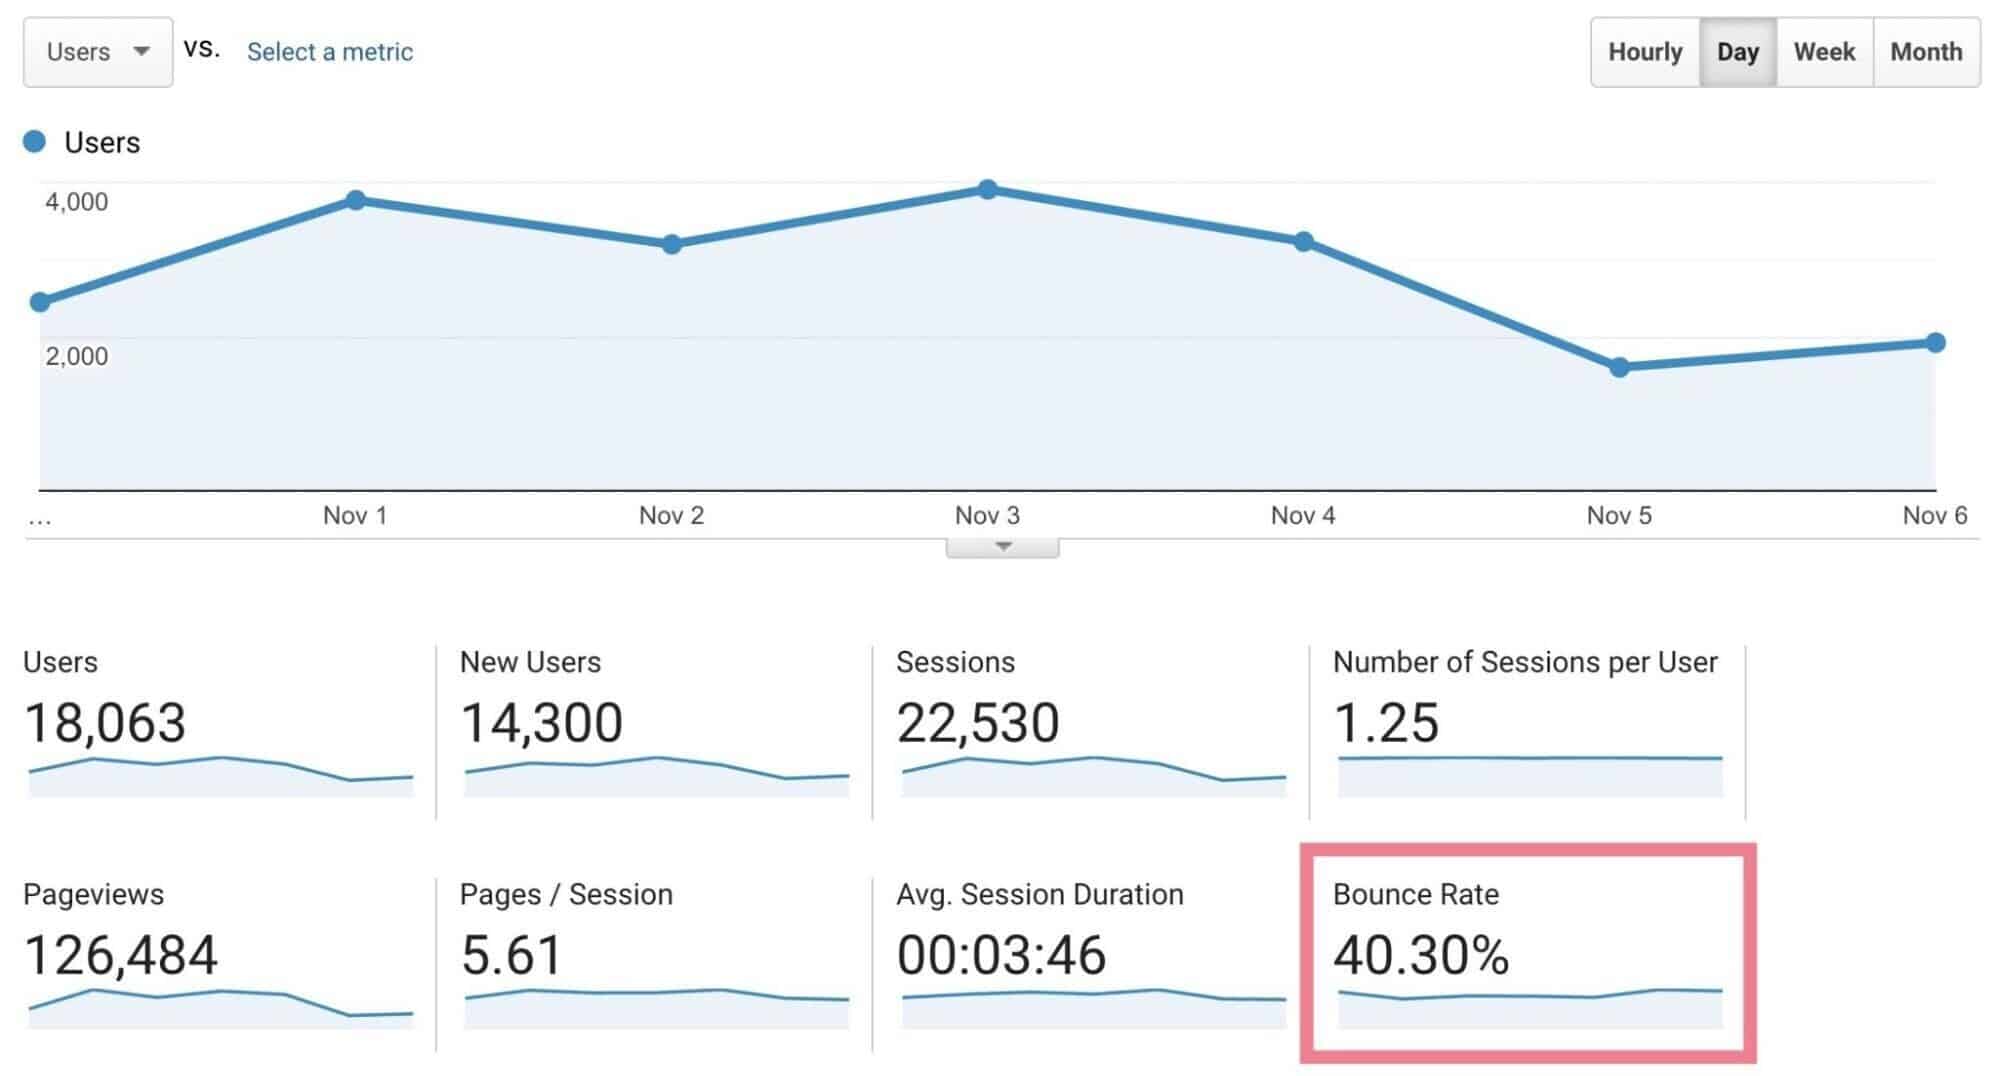
Bounce rate measures the percentage of website visitors who land on a page and almost immediately “bounce off” the page. This metric provides real insight into the level of user engagement on your website.
A high bounce rate indicates that most website visitors leave without engaging further. This is a troubling sign. Left unchecked, it can lead to a lower conversion rate, lower site engagement, and reduced overall website performance.
The reverse is the case with a low bounce rate.
What is a good bounce rate?
On average, the bounce rate for most websites can range between 25% to 70%. Obviously, the goal is to get your site’s bounce rate as low as possible. But do keep in mind that these rates can often vary. Some factors to consider include your traffic source, website visitor’s location, the industry where your business operates, and more.
For instance, visitors who land on your web page from an organic search will likely have a lower bounce rate. Visitors who mistakenly landed on the page from a social media page will likely have a higher bounce rate.
You can easily track your website’s bounce rate using Google Analytics.

To lower the bounce rate, first identify the top exit page through Google Analytics to reduce the bounce rate and determine what could be going wrong. It could be because the content is irrelevant or the page load speed is abysmal. It could also be because the web page needs to be easier to navigate.
#5. Conversion Rate
Here’s one of the most important metrics to monitor: the conversion rate. Why? Because it indicates the effectiveness of your marketing strategy. This metric is responsible for measuring the percentage of website visitors who “convert” into hotter leads of customers by completing a desired action or goal. Examples include clicking “add to cart, filling out a form, or even signing up for a newsletter.
Calculate the conversion rate. It’s easy. Simply divide the total number of your conversions by the total number of unique visitors to calculate the conversion.

A high conversion rate is an excellent sign that your marketing strategies are aligned with your goals and that the business is onboarding more customers. Conversely, a low conversion rate could mean your website visitors need to get more value. This discourages them from going through the final step of the customer journey.
Other engagement metrics worth mentioning
- The Net Promoter Score (NPS) — this is about customer satisfaction and loyalty. The higher the NPS, the higher the customer satisfaction and potential for brand advocacy. With the NPS it’s possible to know how likely they are to recommend the brand to others.
- Feedback Response Rates — measures the percentage of feedback received from users. It is significant as a user engagement metric because it tracks how well users interact with a brand. This shows they’re willing to invest their time to leave feedback about the product.
- Churn Rate — measures the rate customers stop using a product or service over a given period. The lower the churn rate, the higher the user engagement and customer satisfaction levels. This is important for tracking customer retention and loyalty.
Take advantage of gamification to increase user engagement
Gamification incorporates game-like elements — leaderboards, daily/weekly challenges, points rewards systems, etc. — into non-game environments or contexts.
Its primary goal is to introduce fun and enjoyment when interacting with a website or app. Executed properly, gamification can be a powerful tool to drive user engagement.
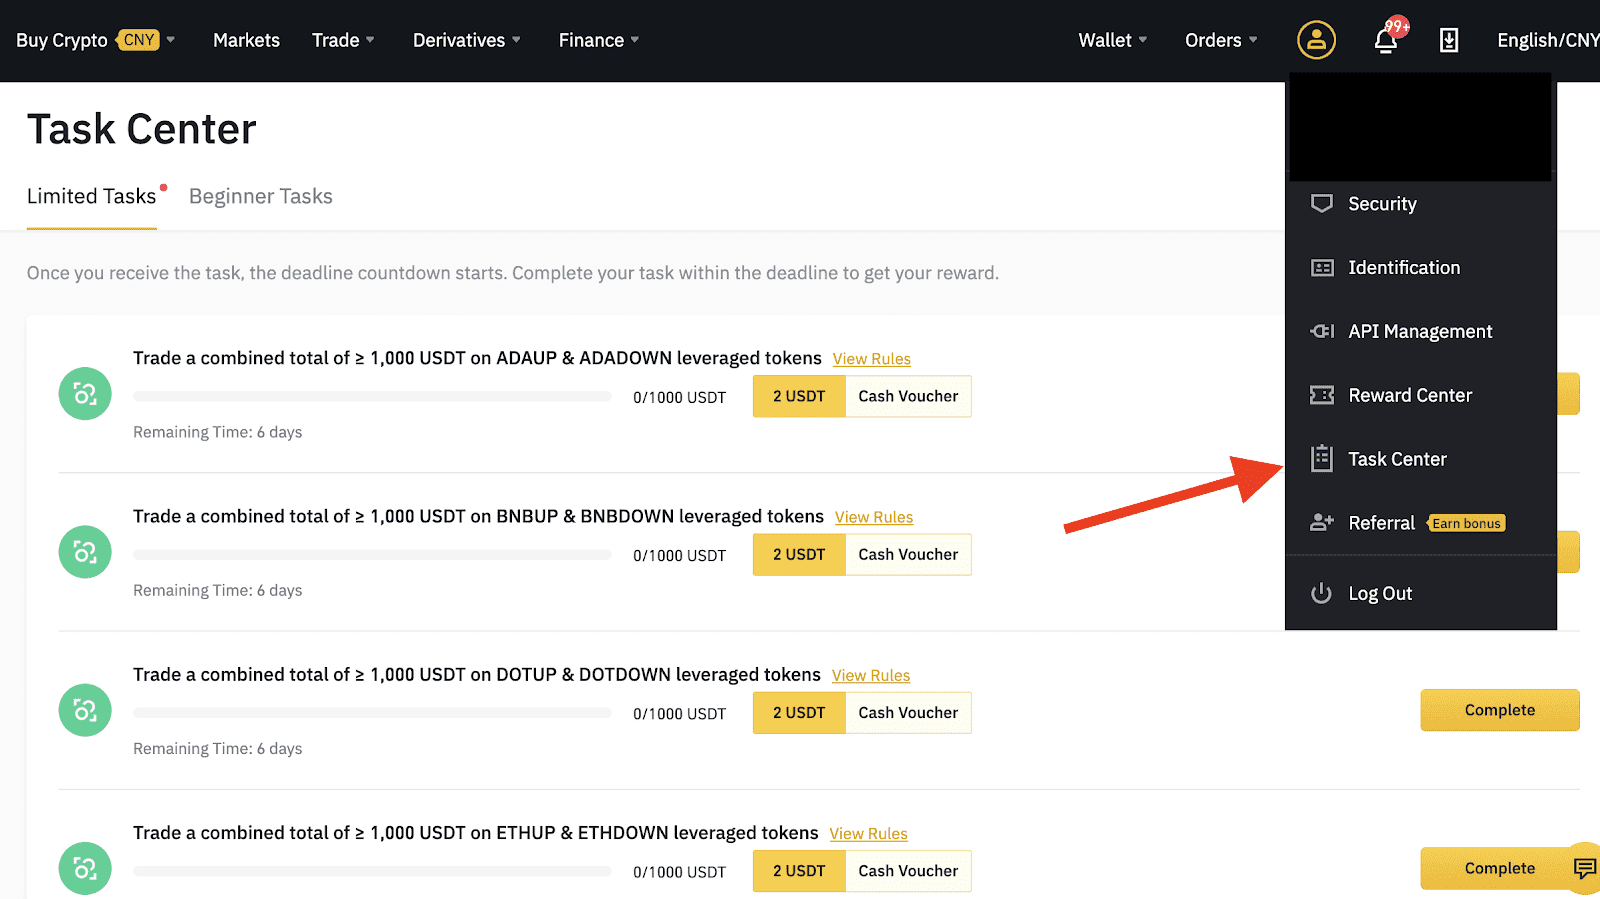
For example, as part of its gamification strategies, popular crypto exchange Binance, offers a tasks program that rewards users for completing challenges and meeting specific criteria.

Source: Binance
Gamification is fast becoming an integral tool in moving the user engagement needle. According to research, the average human attention span has declined over the years, and people are more easily distracted than ever. So it’s getting more challenging for brands to keep users engaged.
Here’s how a well-executed gamification strategy can help drive address this issue and improve user engagement:
- Enhanced motivation — Gamification taps into users’ intrinsic motivation by creating a sense of challenge and achievement. This motivation can drive users to actively participate, complete tasks, and achieve goals, increasing user engagement.
- Improved user learning and skill development — Gamification can provide users with fun challenges or levels that require acquiring new knowledge about the product.
- Increased personalisation — Gamification provides a sense of personalisation by allowing users to customise their avatars and game elements. This makes them feel more connected to the brand, leading to increased engagement.
- Increased social interaction — Gamification helps foster user competition and social interaction through elements like leaderboards and missions. This helps create a sense of community that drives customer loyalty and engagement.
- Rewards and incentives — Gamification often includes a robust rewards system that incentivises users to engage with a brand. Additionally, these rewards help create a sense of achievement and satisfaction, which is suitable for the overall customer experience.
Read also: Gamification Examples: The Ultimate List For User Engagement
Gamification with Mambo.io
If you want to incorporate gamification into your company’s marketing strategy, Mambo.io provides a suite of gamification solutions to drive targeted results.
In addition to its extensive lineup of game elements, the Mambo gamification platform lets businesses track user behaviour, set goals, and deliver real-time feedback with notifications to users.
Schedule a demo to learn more.
Conclusion
User engagement is central to any successful business strategy. If people aren’t engaging with your product, you’re not making any sales. It’s that simple! You gain valuable insights for better decision-making by tracking user engagement metrics relevant to your business.
Latest Posts
Machine Learning In Finance: 12 Essential Applications
The impact of machine learning on finance is significant. Thanks to this technology, financial institutions are now equipped to make efficient decisions. Through the analysis of data sets, machine learning […]
How To Create Interactive Compliance Training For Bank Employees
Banking compliance training isn’t just another task. It’s the stage where everything else performs. Banks must navigate a myriad of regulations and laws. After all, this is a trust-driven, high-stakes […]
How Fintech Apps Are Using Gamification To Increase User Engagement
Discover how gamification in fintech is revolutionizing financial engagement, making banking fun & boosting user loyalty.


