TAM SAM SOM: A Roadmap to Market Domination
TAM SAM SOM – these metrics provide invaluable insights into the market size and opportunities associated with a product. As such, there’s a particular urgency in learning the intricacies of these terms if you intend to thrive in a competitive landscape.
In this article, we’ll embark on a journey through the depths of TAM SAM SOM. We will unravel their significance, explore the calculation process, and explore examples.
Table of Contents
- What is TAM SAM SOM?
- How to calculate TAM SAM SOM
- What is the purpose of TAM SAM SOM?
- Closing thoughts on TAM SAM SOM
- Machine Learning In Finance: 12 Essential Applications
- How To Create Interactive Compliance Training For Bank Employees
- How Fintech Apps Are Using Gamification To Increase User Engagement
- Top Gamification Companies for Employee & Customer Engagement
What is TAM SAM SOM?
TAM SAM SOM are all metrics sales specialists use to assess market potential.
While they all contribute valuable insights, each offers a distinct perspective on market opportunities and size. Let’s look at what each of these metrics entails.
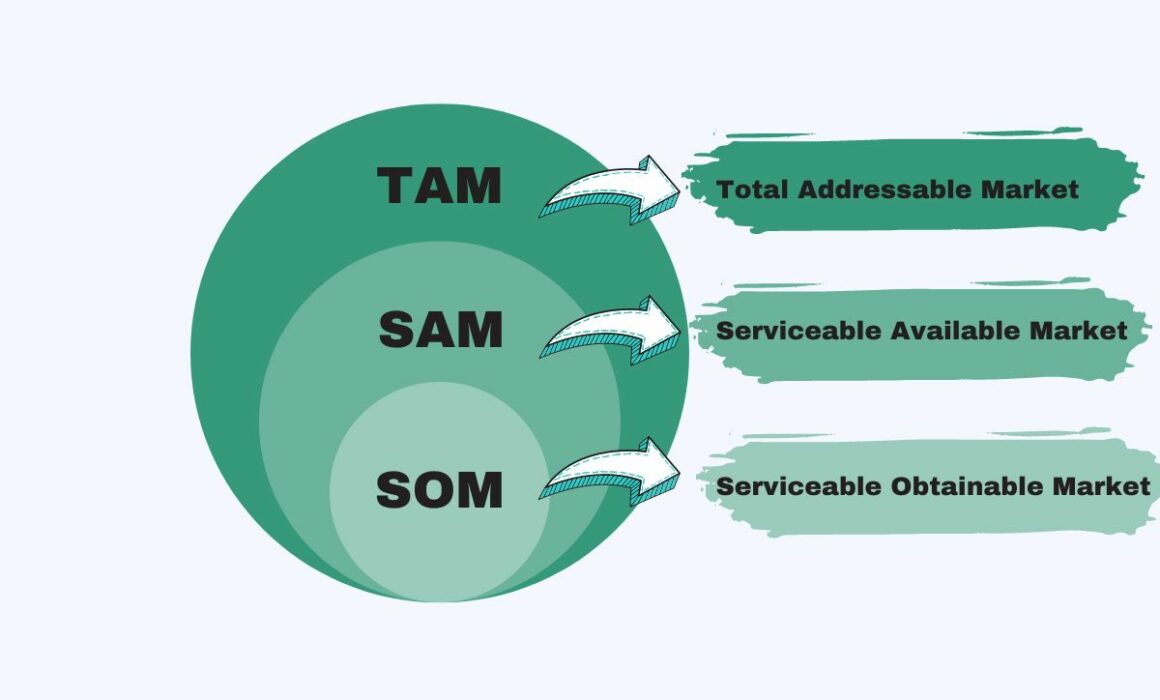
TAM (Total Addressable Market)
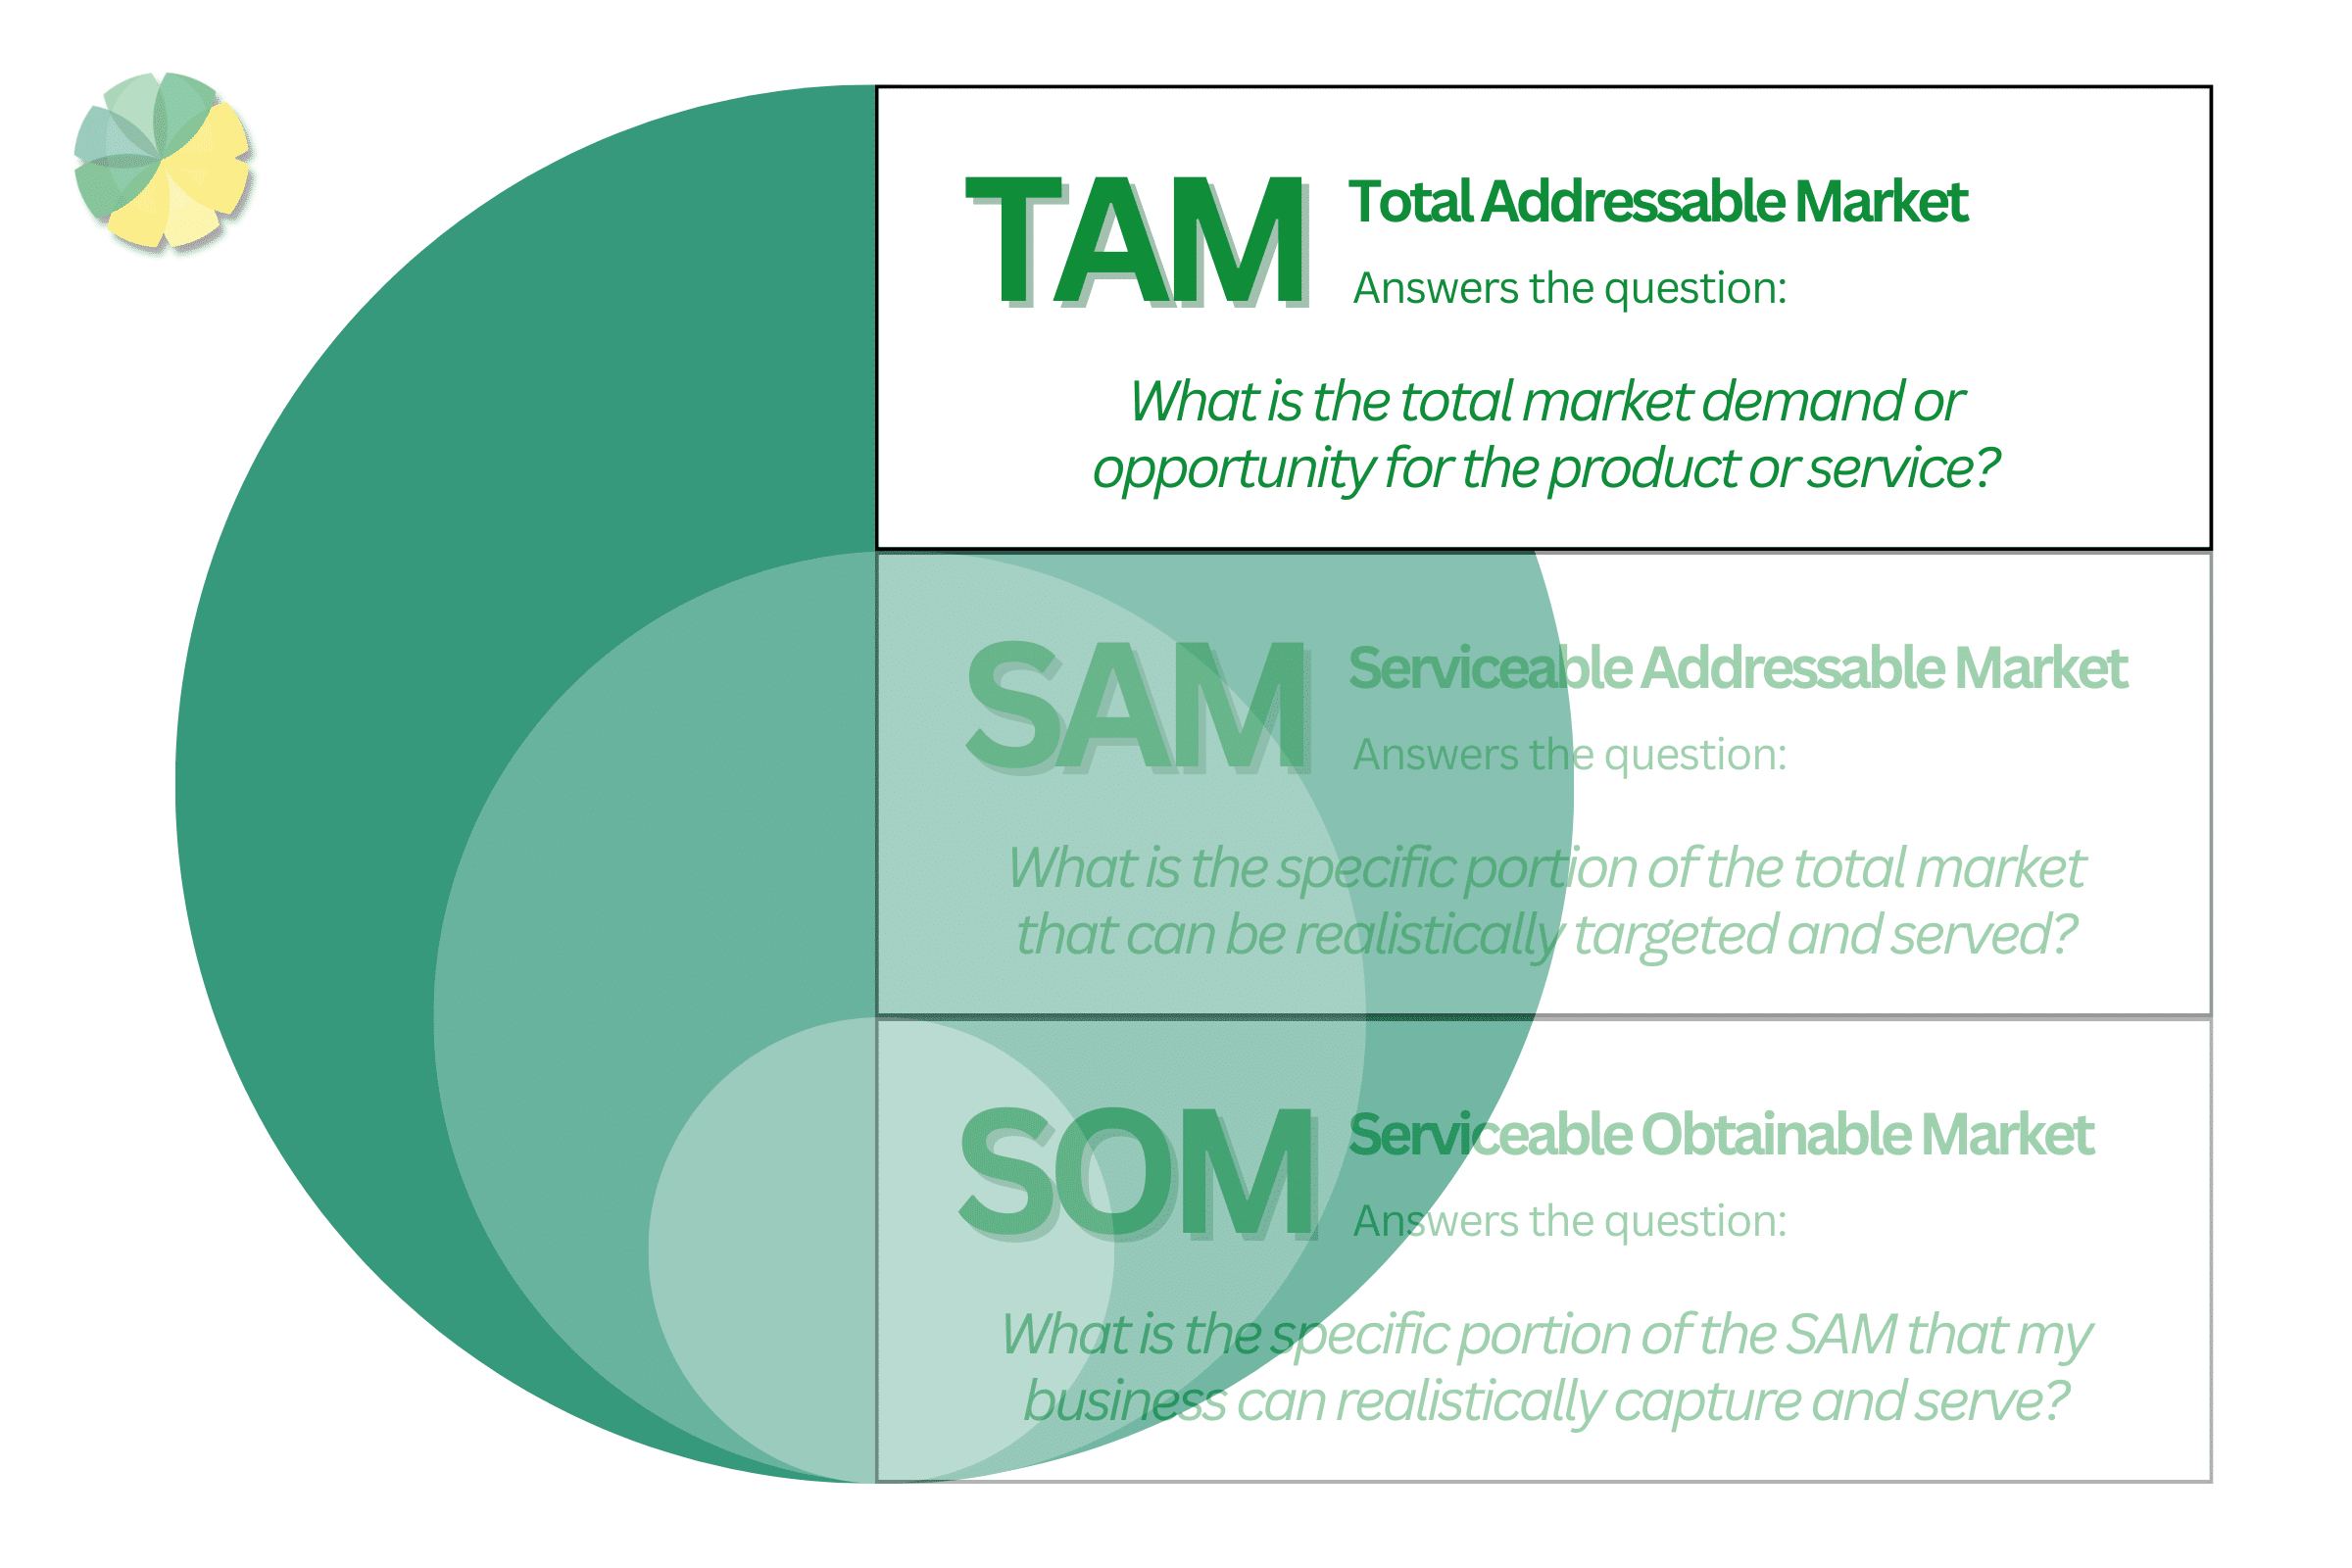
TAM (Total Addressable Market) represents the total market of a business or product.
TAM SAM SOM are represented in terms of monetary value since they correlate to a specific market’s potential revenue.
TAM will always have the highest value out of these three sales metrics. That’s because it doesn’t consider market constraints, which are usually an issue.
Instead, it highlights the maximum revenue you can generate, assuming you can dominate 100% of that market. In short, it represents an industry’s profit potential.
SAM (Serviceable Addressable Market)
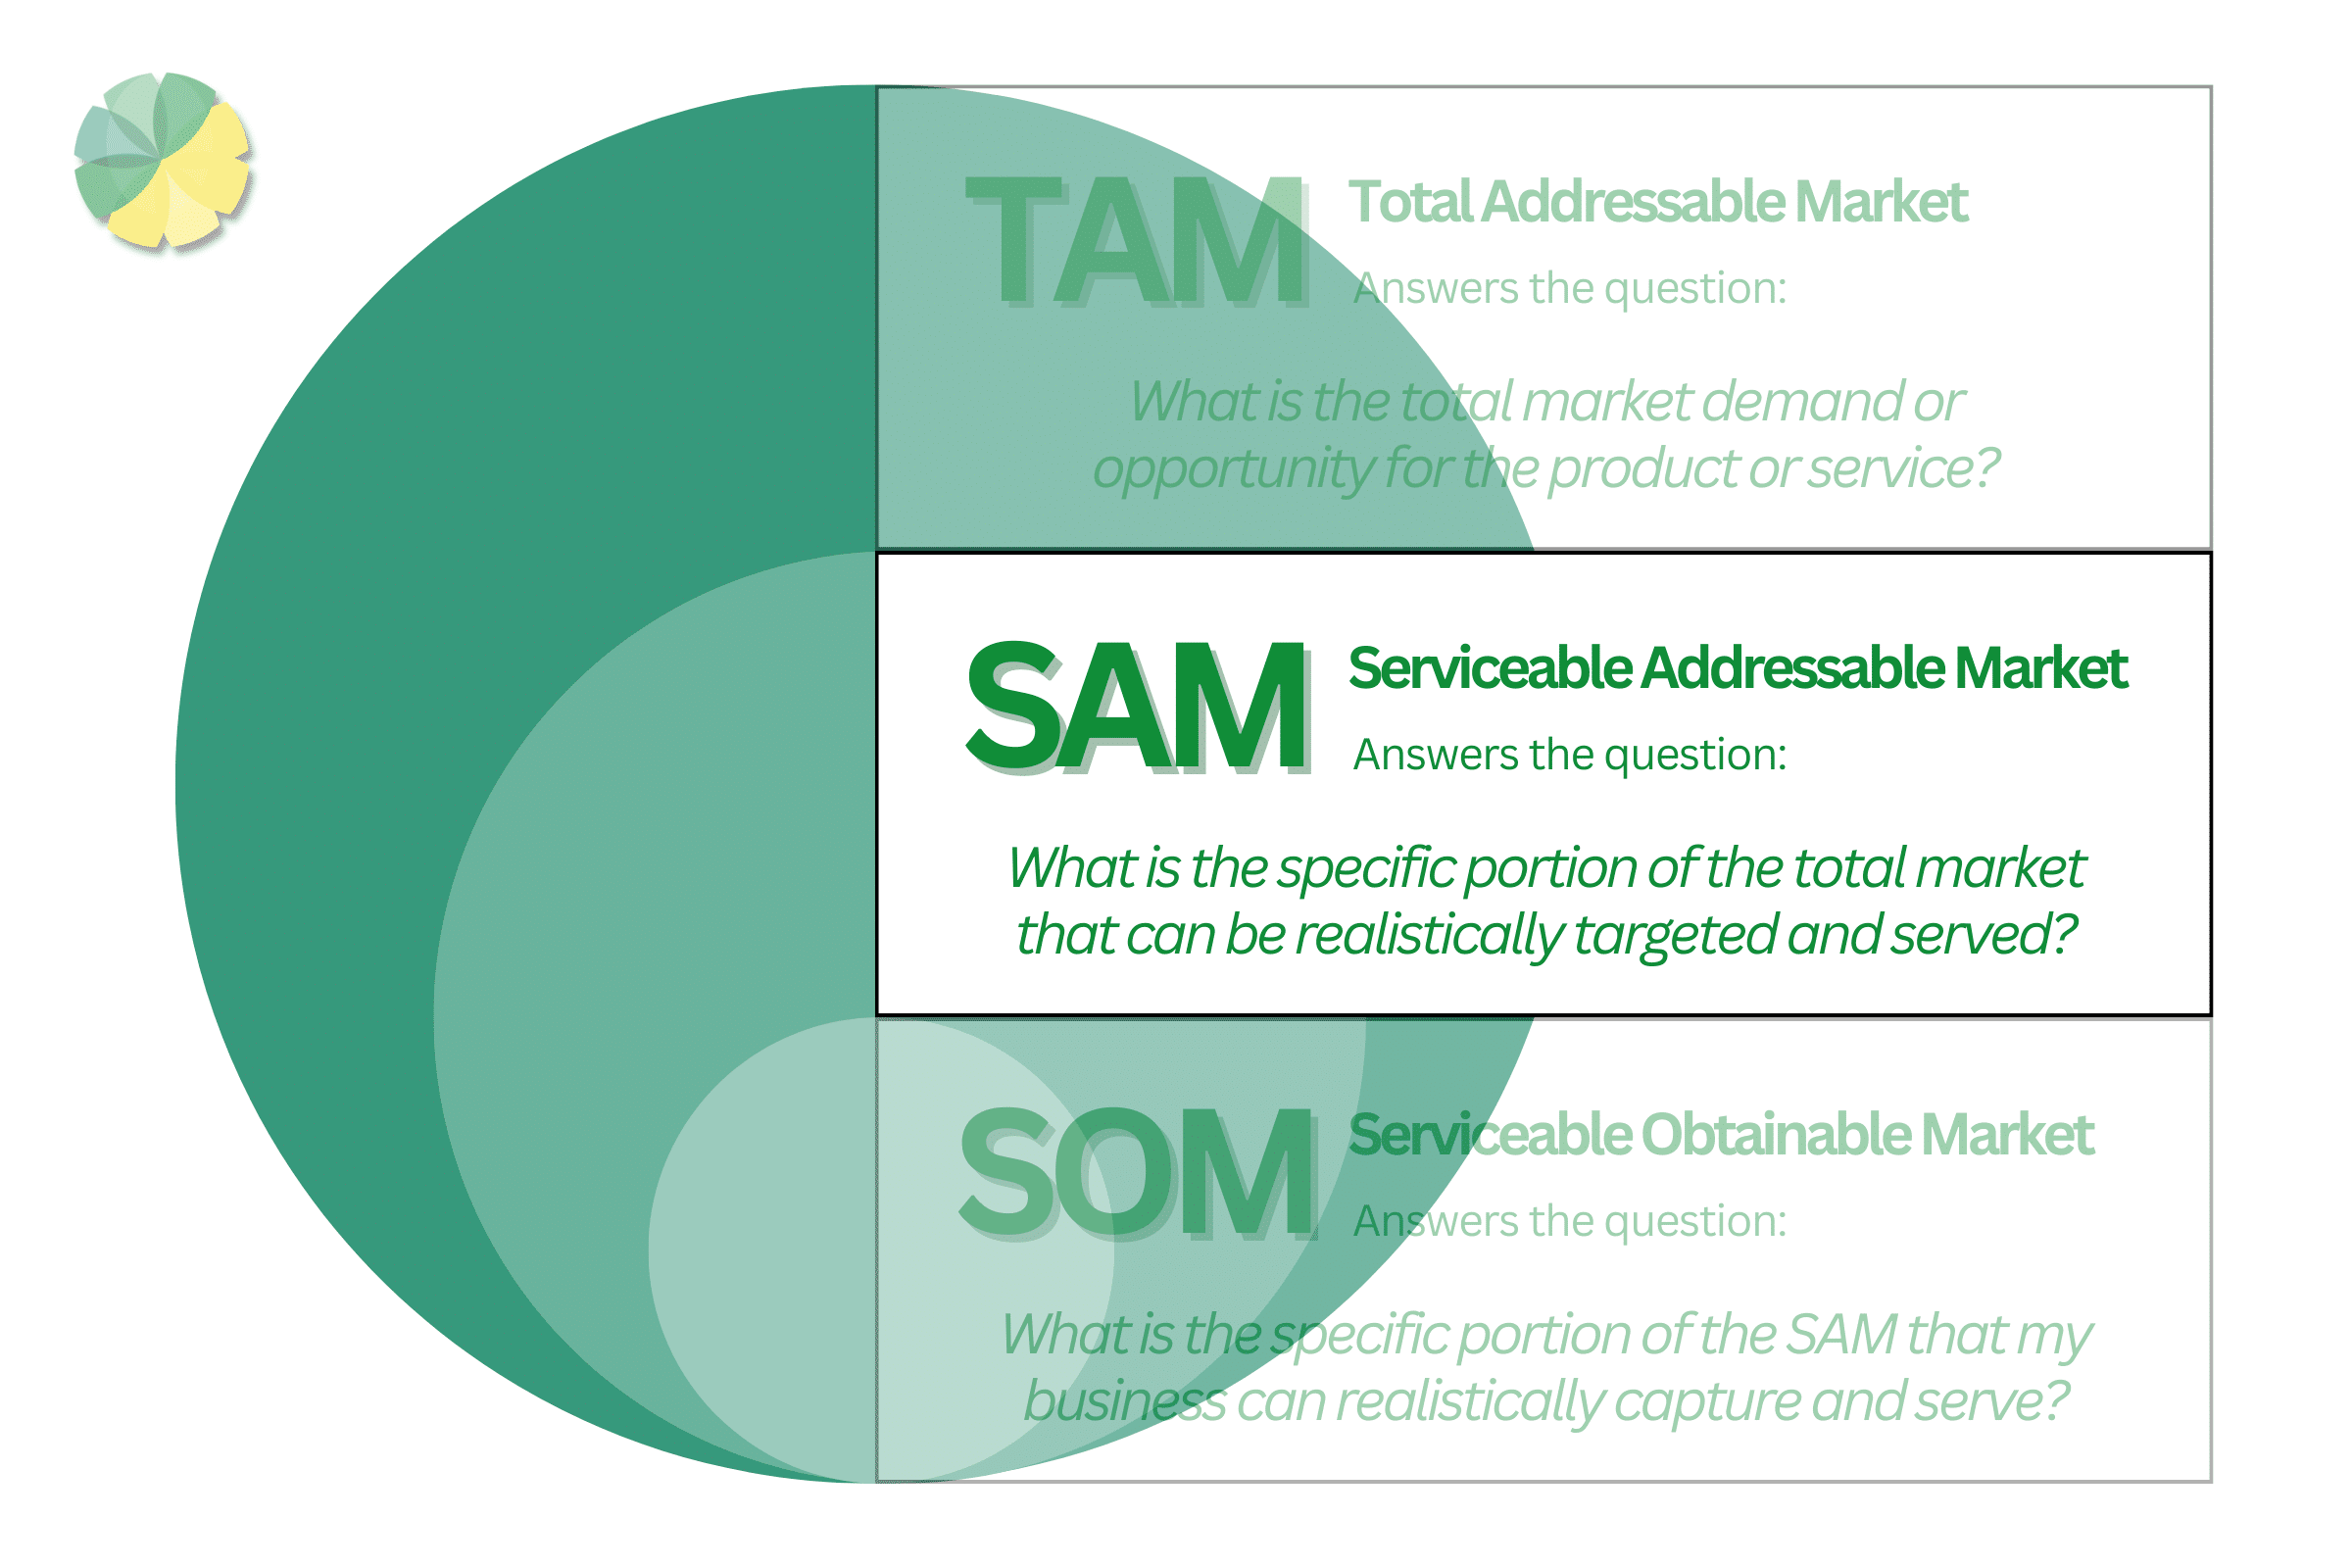
SAM (Serviceable Addressable Market) is a step lower than TAM.
Rather than including the entirety of the market, it only covers customer segments. It’s the specific market portion you can target and serve.
Unlike TAM, you must consider constraints that can narrow the market share.
These may include market constraints like:
- Location (in the case of physical products)
- Demographics
- Specific customer preferences
- Practical considerations
These constraints primarily concern the consumer market. However, like TAM, it assumes you can dominate 100% of that specific market segment.
SOM (Serviceable Obtainable Market)
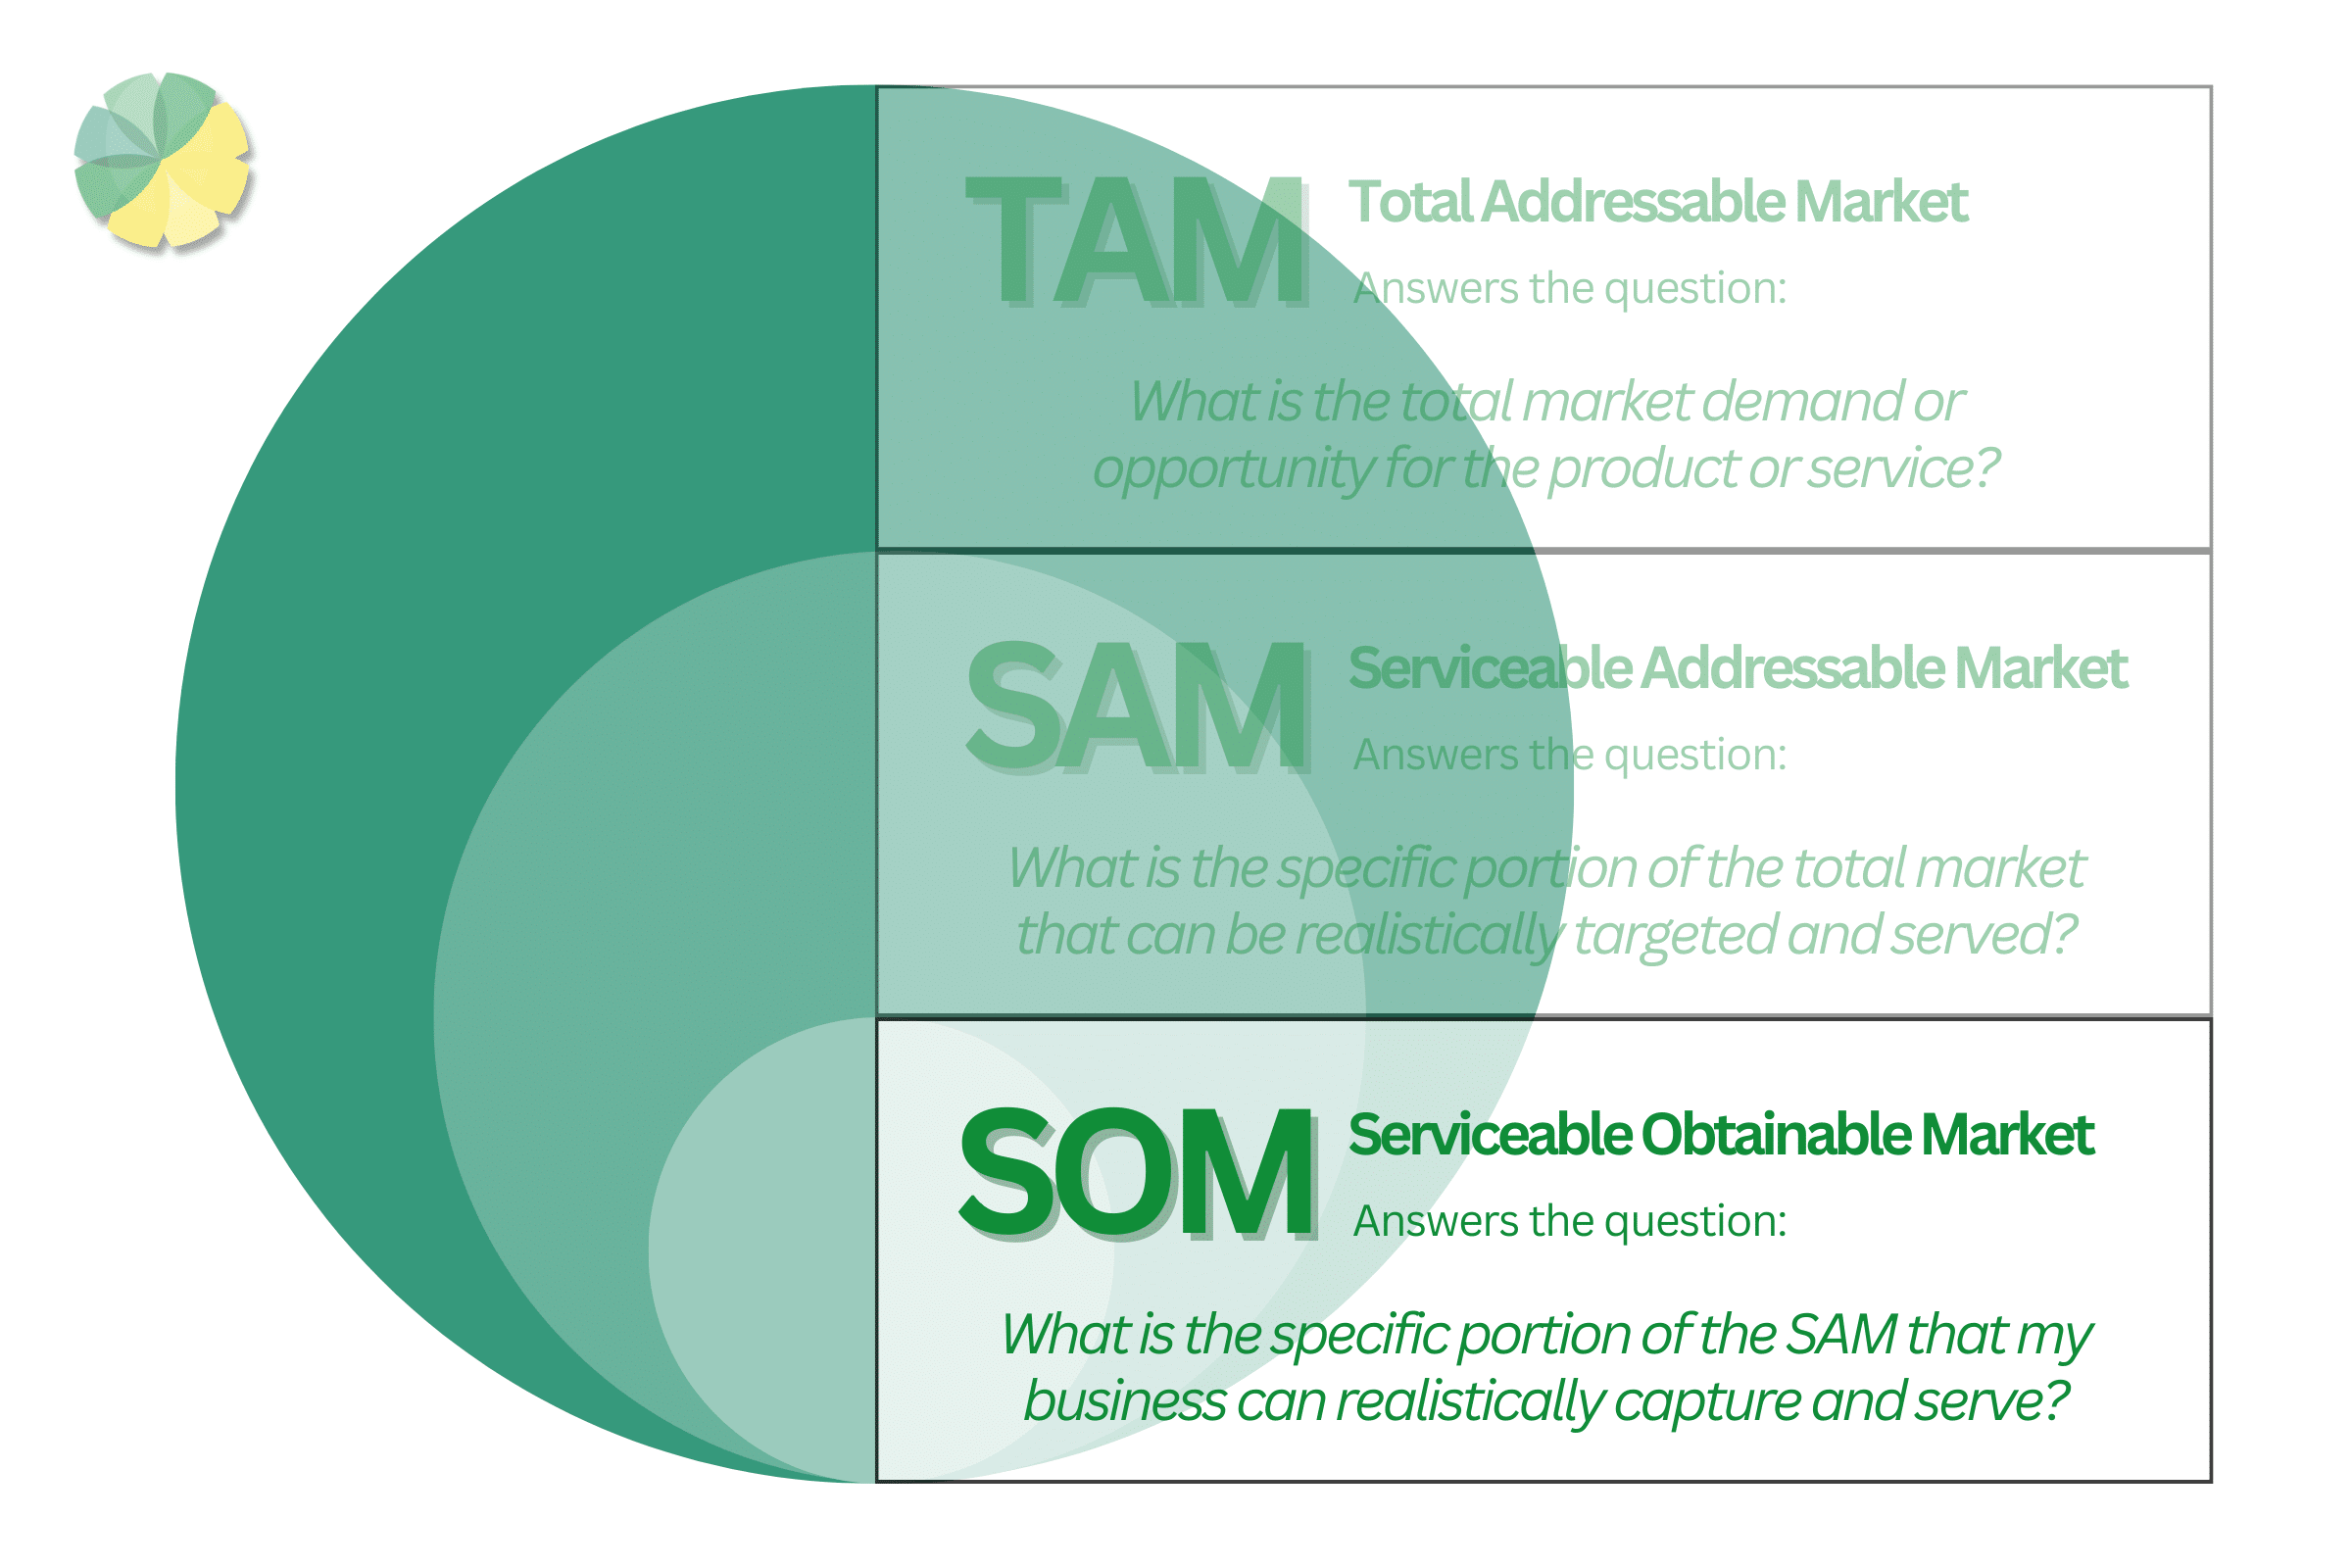
SOM (Serviceable Obtainable Market) is an even smaller market segment and is a step lower than SAM. It’s the portion of the market that you can effectively reach.
Similar to SAM, it takes into account several constraints and limitations.
This time, however, these constraints mostly pertain to your company’s capability rather than the market size. Examples of such constraints include your company’s:
- Production capacity
- Distribution channels
- Marketing channels and strategies
- Available resources
- Customer acquisition strategies
- Existing competition
The SOM will always be a portion of SAM, as SAM is a portion of TAM. Given your resources, it assumes that you can only dominate a portion of the SAM.
TAM SAM SOM in a nutshell
It becomes a lot simpler if you were to think of TAM SAM SOM this way:
You’re an oil explorer looking for potential oil reserves in Texas.
- The TAM is the entire land of Texas. It encompasses all the oil reserves within it, both known and unknown, regardless of boundaries of legalities.
- The SAM is a specific oil field in Texas. It sets a more realistic goal for this venture. SAM considers legal constraints and geological conditions but assumes that you can take over that specific region.
- The SOM is the oil reserve/s within the oil field (SAM) you can realistically monetise. It considers your company’s capabilities, including your extraction technologies and techniques. SOM also accounts for the competition in that oil field and total market demand in Texas.
TAM helps you realise the potential oil revenue in that region. SAM narrows down the region and represents only an oil field, for instance, that you can take over. Given your resources, SOM represents the SAM portion you can extract.
Though SOM often plays the most important role among these three, it’s still advisable to know all three: TAM SAM SOM.
How to calculate TAM SAM SOM
TAM (Total Addressable Market) calculation
TAM formula
The formula itself is relatively straightforward. It is as follows:
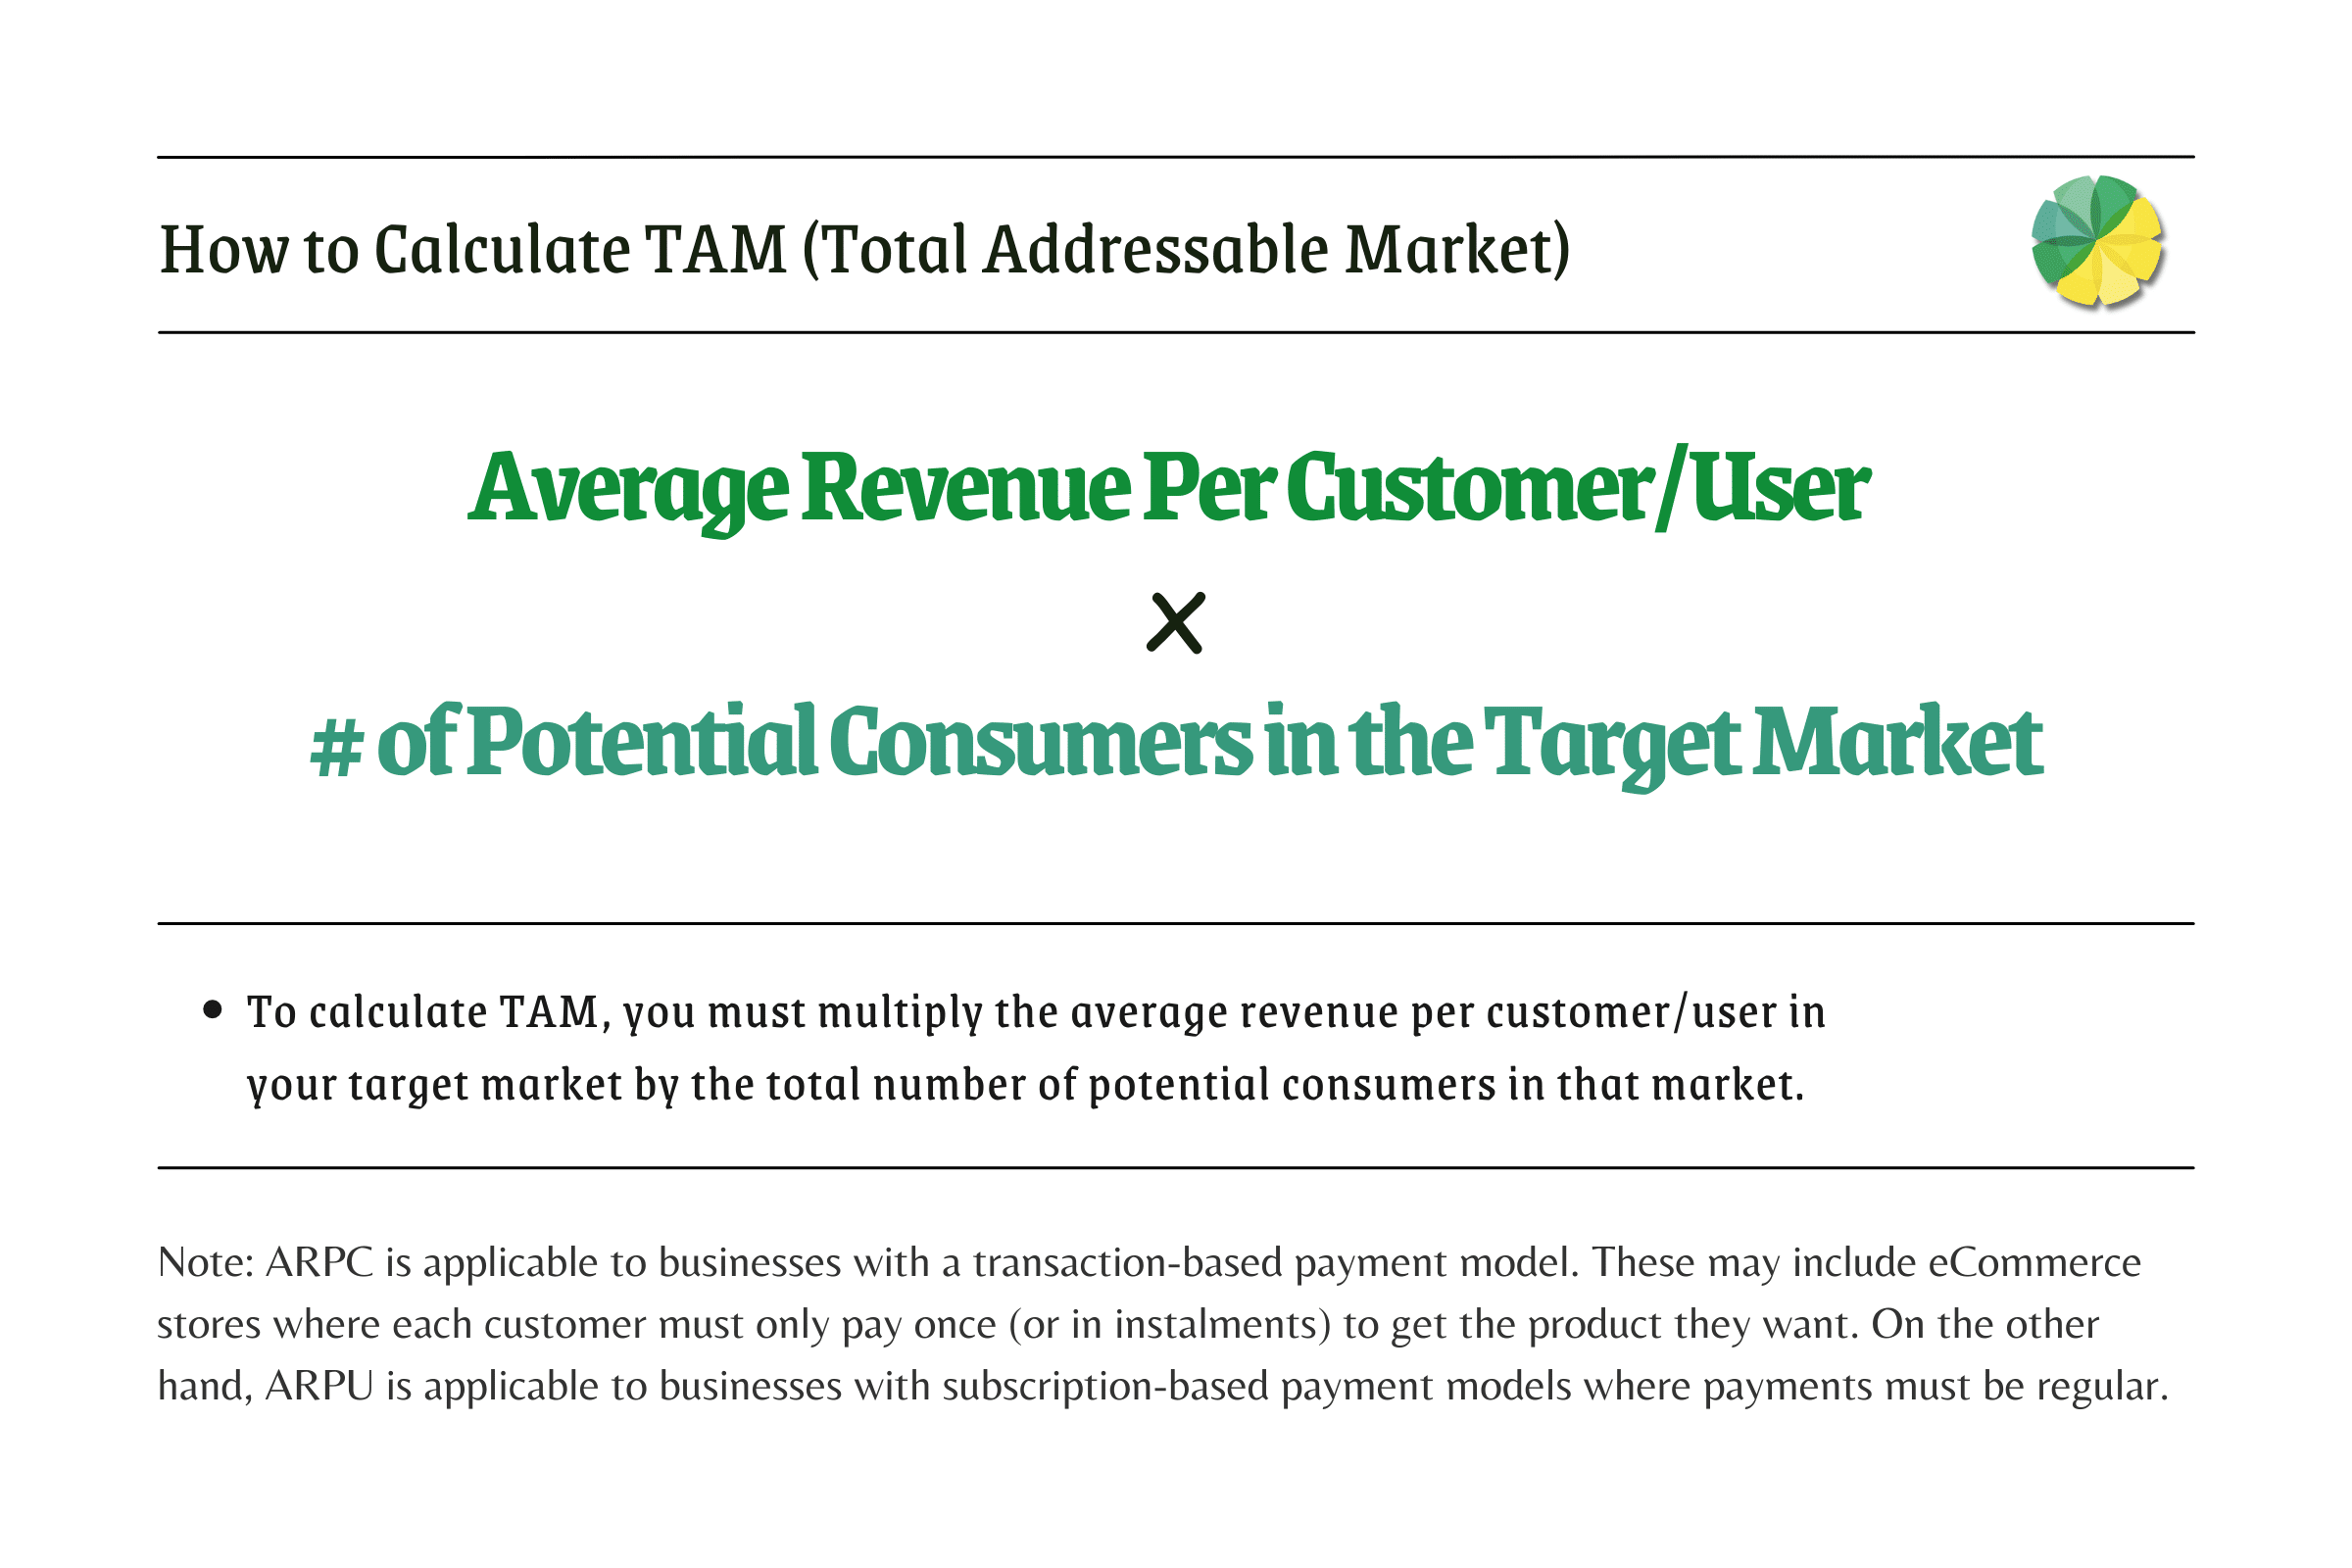
The tricky part is obtaining the necessary data for the calculation, namely the:
- The average revenue per customer/user (ARPC/ARPU) in the target market
- Total number of potential consumers in the target market
That will likely bring you the most trouble, so let’s focus on those instead.
The average revenue per customer/user (APRC/ARPU)
This data is exactly as the name implies.
It’s the revenue that consumers of your product spend on average within a specific time period. This can be monthly, quarterly, or annually. It ultimately depends on you.
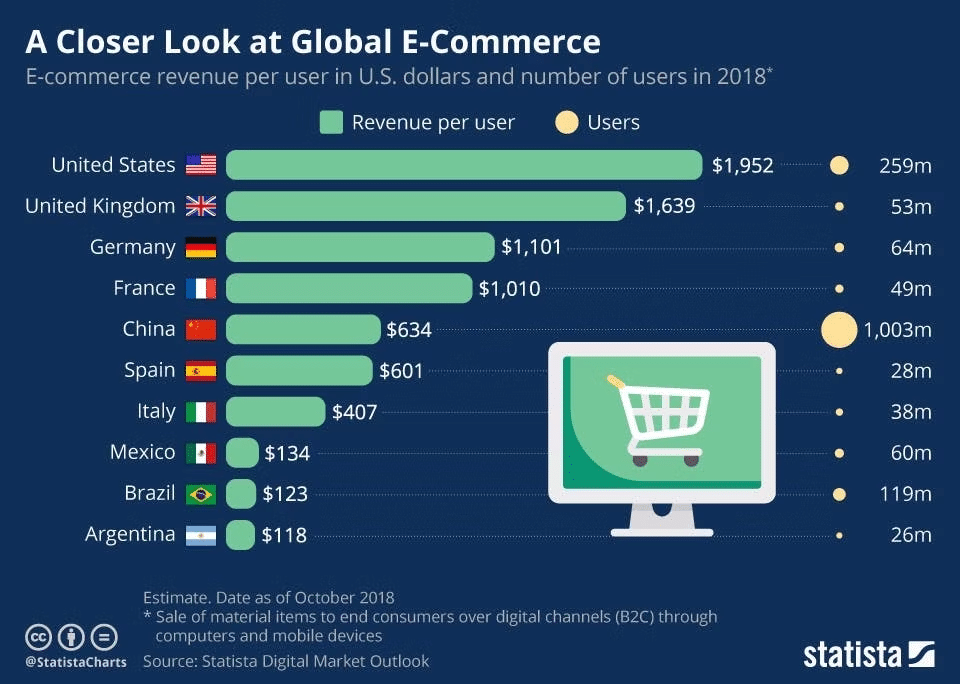
Source: Statista
There are two types of scenarios. You either already have a running business or a product, or you’re still in the market research and business planning stage.
In the case of the former, this data is easy to come by. Here’s what you need to do:
- Calculate the total revenue generated by your business or product within a specified time period (monthly, quarterly, or annually).
- Count the total number of customers/users you have during that period.
- Divide the total revenue by the total number of customers/users.
However, if you have yet to launch your business idea or product, you must instead rely on external sources. Mainly, you can do the following:
- Look up industry benchmarks on ARPU or ARPC.
- Analyse the pricing models of companies in your industry that offer similar products or services to your target audience.
- Given a product concept, survey your potential customers about what they’re willing to spend within a specified time period.
- Search for other sources (case studies, industry reports, etc.).
Total number of potential consumers in the target market
This piece of data mainly involves estimating the size of an entire market.
Unlike ARPC/ARPU, it doesn’t matter whether you already have a running business. Your in-house data won’t be relevant. Instead, you’ll use external sources.
To start with, you must first identify your target market.
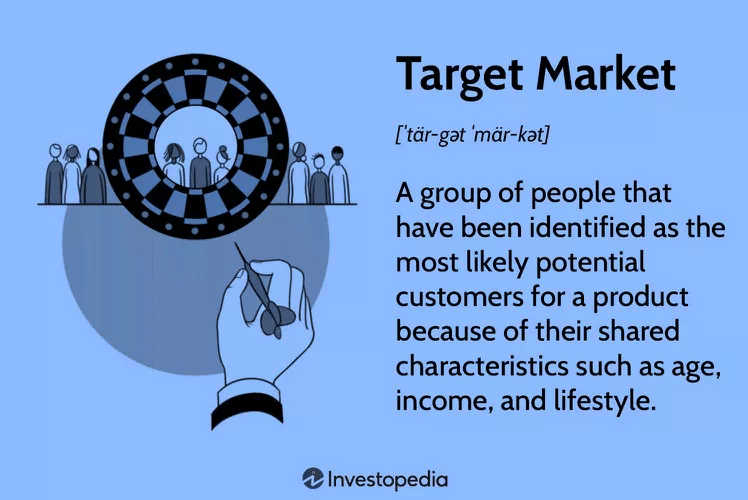
Source: Investopedia
You must then gather relevant data to estimate the number of potential customers in that market. There are generally two methods sales specialists use for this process.
- The top-down approach starts by counting the total number of people worldwide. You then narrow it down based on factors like geography and demographics. You continue doing so until you reach the target market.
- The bottom-up approach is the opposite. It starts by defining the smallest possible segment of your target market. You then expand that across an entire country or industry until you reach the target market.
The bottom-up analysis is suitable if your business is already running since you have a number to start with. You only need to extrapolate on this figure. On the other hand, the top-down approach is great for those who have yet to launch their business.
TAM calculation example
To illustrate further, let’s consider the example of a product in the fitness sector.
Assume you’re developing a digital fitness app. Here’s how you calculate the TAM:
- Identify the segment of the population you want to target. In this case, your target market is individuals interested in workouts in the UK.
- Determine the ARPC/ARPU of that specific segment. Market insights indicate that the ARPU of digital fitness apps in 2023 is £23.64.
- Identify your target market. Using the top-down approach, start by counting the world population. Narrow it down to the UK population. Then narrow it down to the percentage of the population interested in workouts.
- Work out the number of total potential customers in that market. Worldometers show a UK population of 68,931,327 in 2023. Meanwhile, research says 26.15% of the UK population might be interested in fitness apps. The final number comes to 18,025,542 by taking 26.15% of 68,931,327.
- Calculate the TAM using the formula. Multiply the ARPC by the number of total potential customers. The calculation will be as follows:
TAM = ARPC/ARPU x Total Number of Potential Consumers in the Market
TAM = £23.64 x 18,025,542 customers
TAM = £426,137,778.50
This tells us that you can generate £426,137,778.50 in 2023 if you can dominate 100% of the market. Of course, that’s not only unlikely but impossible.
So, we must move on to a more realistic figure—the serviceable available market.
SAM (Serviceable Addressable Market) calculation
SAM formula
The formula for SAM is likewise straightforward. It is as follows:
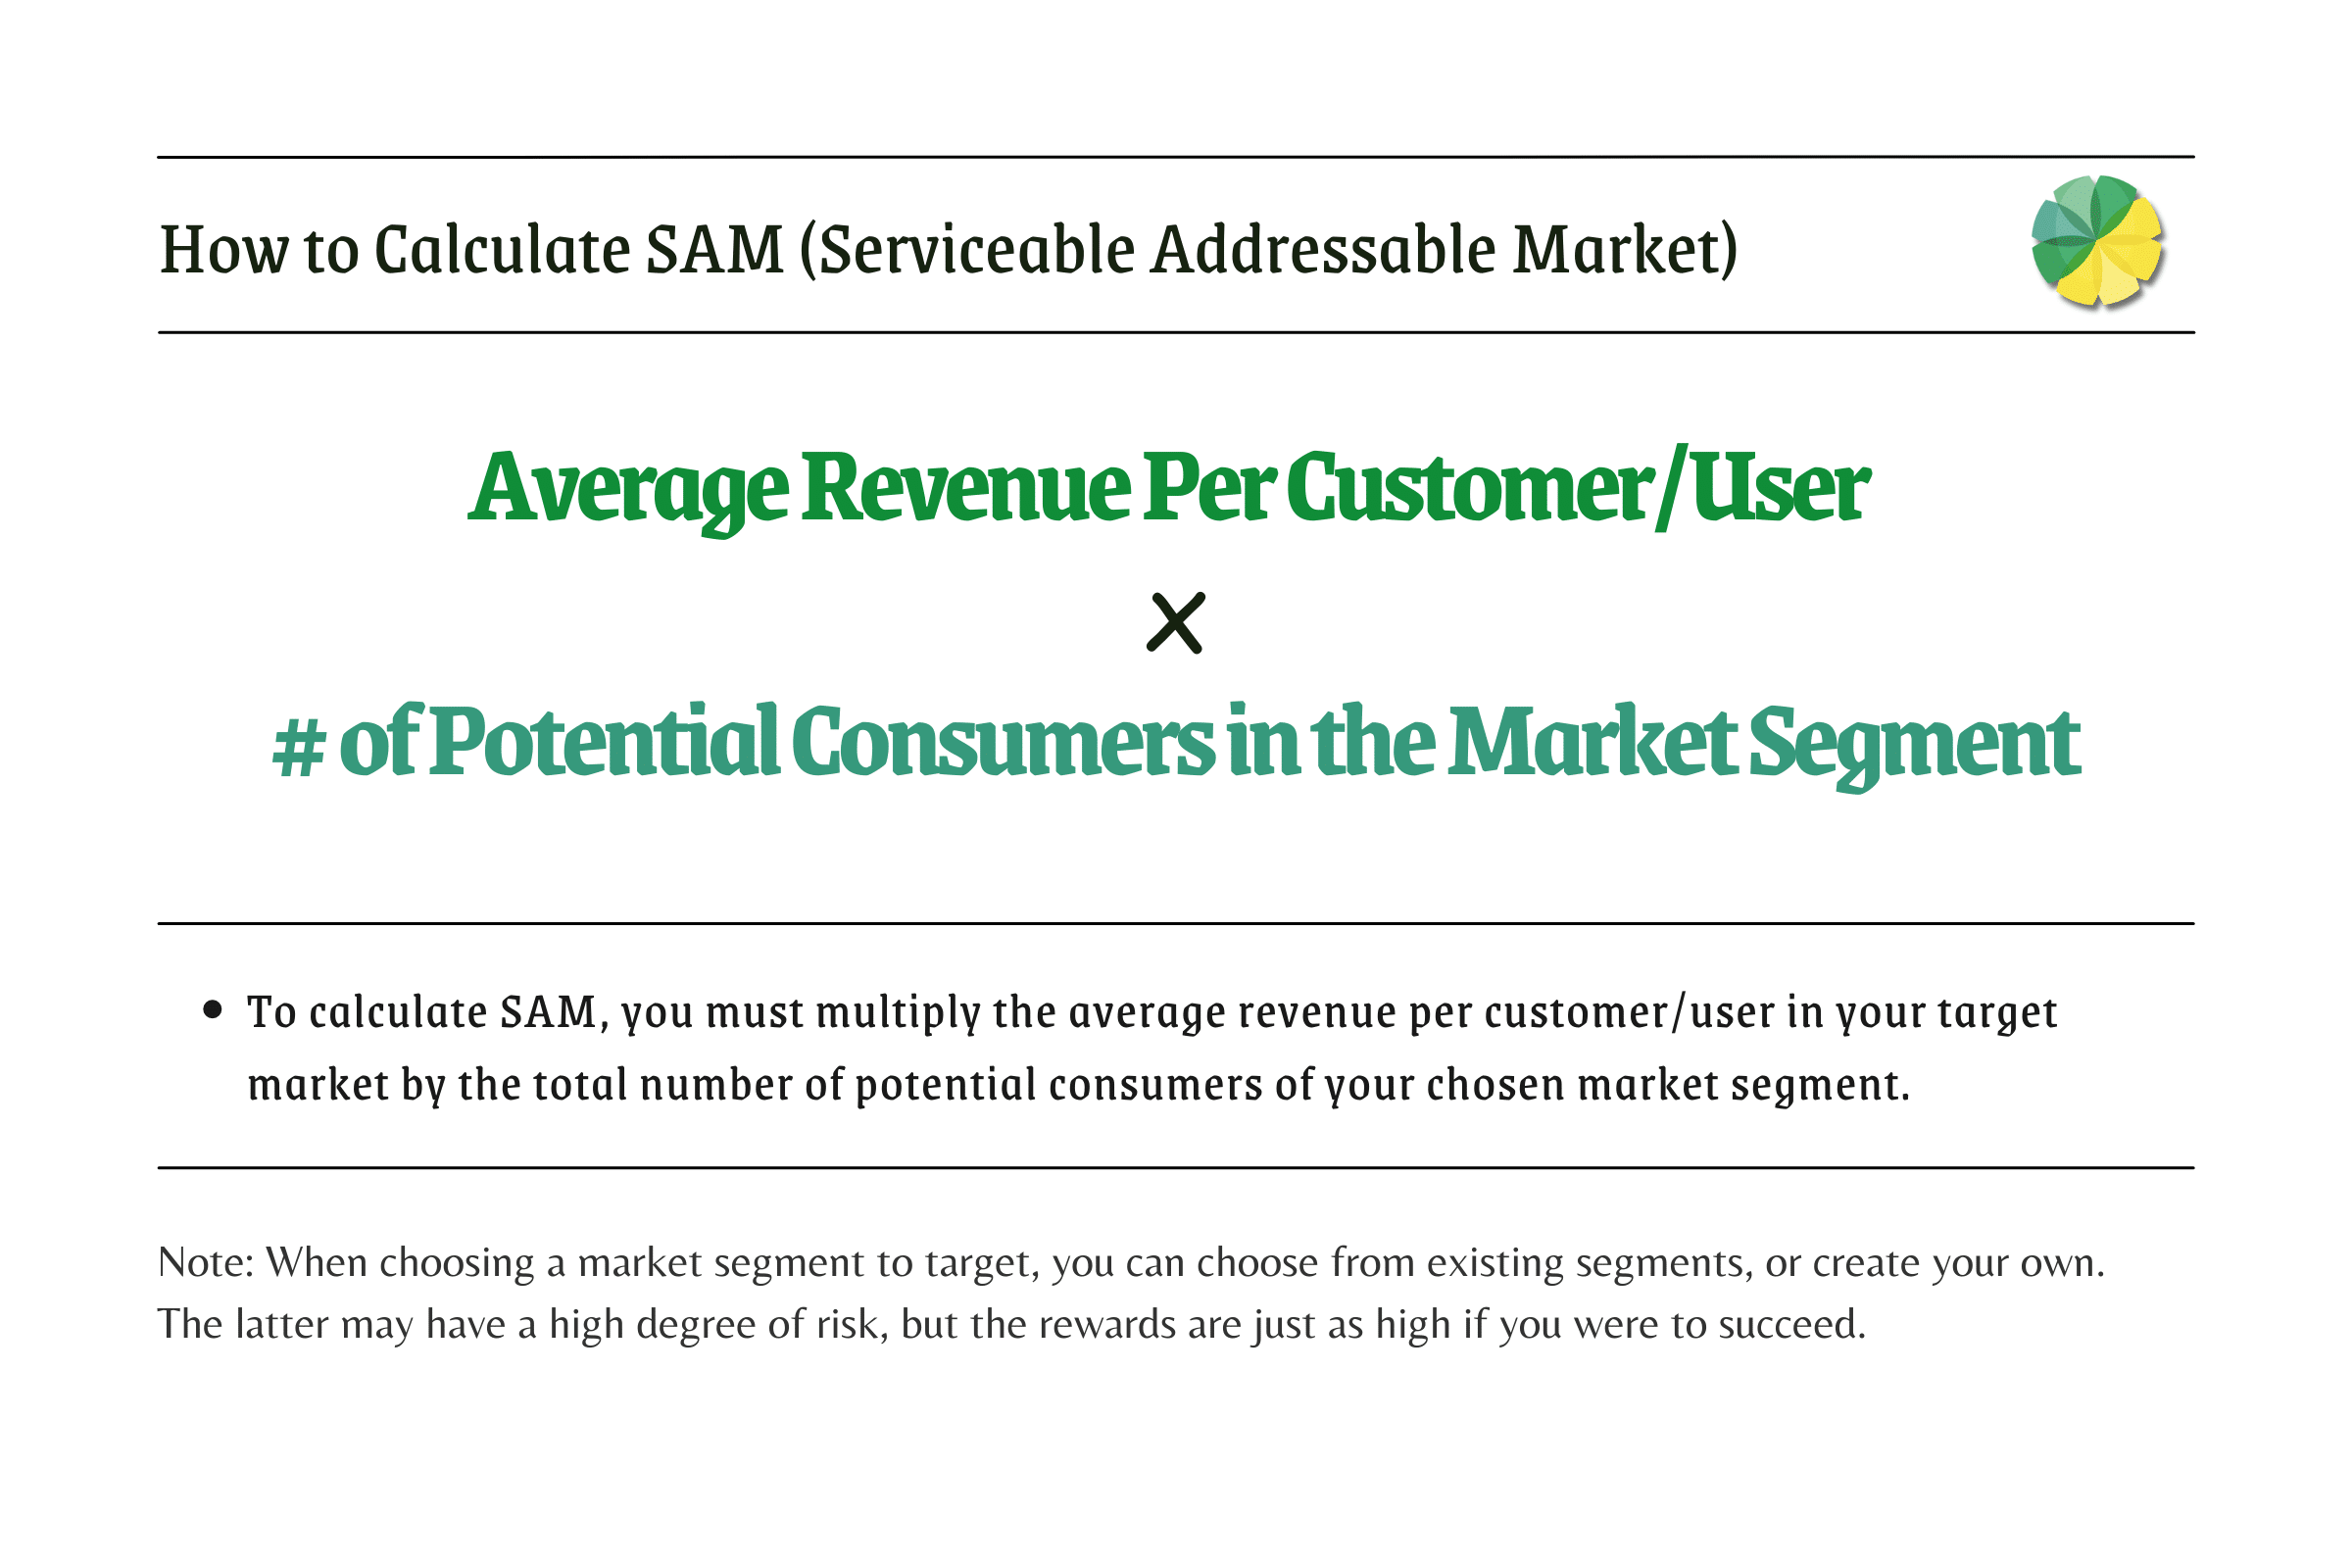
Furthermore, like TAM, SAM also only requires two pieces of data, namely:
- The average revenue per customer/user (ARPC/ARPU) in the target market
- Total number of potential customers in the market segment
Like before, data collection will be the difficult part of this process.
The average revenue per customer/user (APRC/ARPU)
The ARPC/ARPU remains the same.
The second piece of data, however, will be different. More specifically, it’ll be lower than the number we used previously for TAM.
Total number of potential consumers in the market segment
If you used the top-down approach in the previous section, you only need to continue where you left off. That is to say, and you must narrow down your target market further.
This time, however, rather than narrowing it down to a country or industry, you must consider more specific factors, such as the following:
- Geographic location
- Demographics (e.g., age, gender, income level, occupation)
- Psychographics (e.g., lifestyle choices, attitudes, interests, goals)
- Customer preferences and behaviour
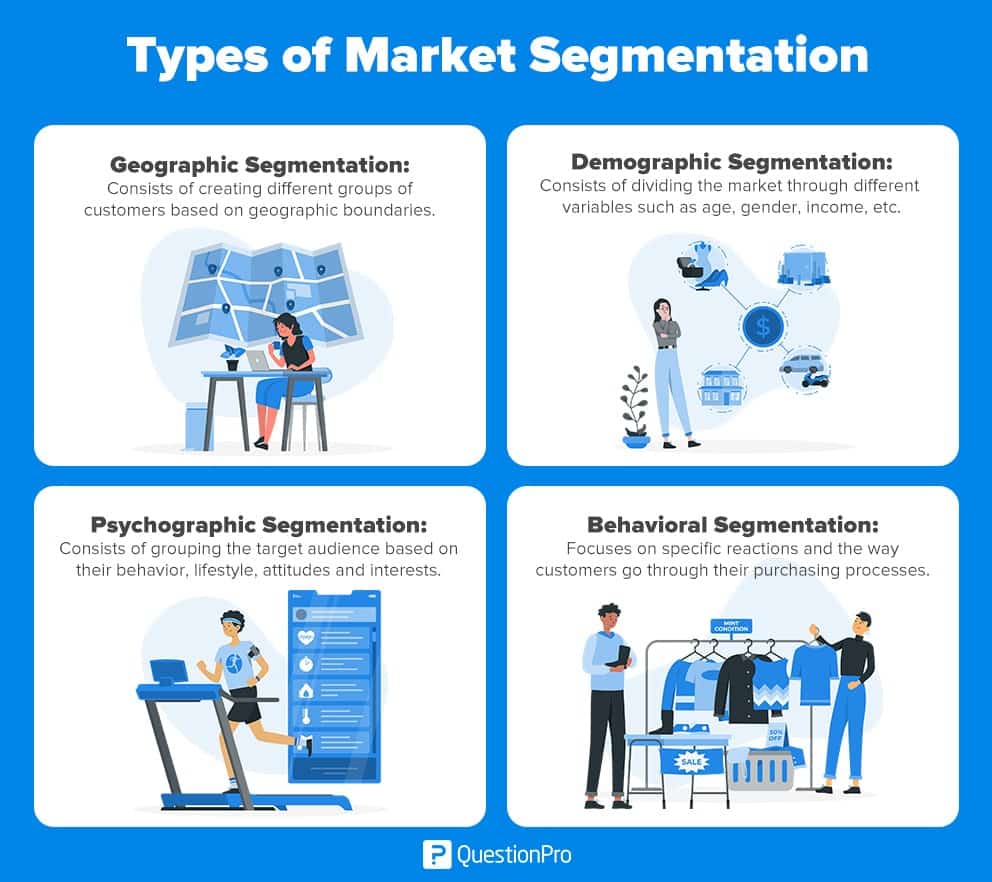
Source: QuestionPro
This is also called market segmentation.
SAM calculation example
Let’s continue with the previous TAM SAM SOM example.
You can start by narrowing down your target market according to each factor:
- Geographic location – Since you’re developing an app, this factor is irrelevant as you can reach and convert anyone in the UK.
- Demographics – Senior citizens and young adults have a different physiology than adults. You don’t intend on including workouts tailored for them, at least for now. So, your target demographic would be specifically adults in the UK.
- Psychographics – You plan on offering detailed plans on workouts that require gym equipment. Hence, your target psychographic will be gym goers.
- Customer preferences – You’re developing a mobile app, so we’ll also include “smartphone users” as a market-narrowing factor.
With these in mind, you’ll end up with only a portion of the TAM potential consumers.
Let’s assume the following estimations are true based on historical data and statistics:
- 30% of the TAM potential consumers are adults
- 15% of the TAM potential consumers go to the gym
- 80% of the TAM potential consumers use smartphones
Keep in mind that these percentages are hypothetical. Regardless, if we calculate this, we end up with 3.6% of the TAM potential consumers, which is 648,919 consumers.
30% x 15% x 80% = 3.6%
3.6% x 18,025,542 = 648,920
Once you have the total number of potential consumers in the market segment, you go on with the standard formula:
SAM = ARPC/ARPU x Total Number of Potential Consumers in the Market Segment
SAM = £23.64 x 648,920 customers
SAM = £15,340,468.80
Again, while this figure is possible, it’s not realistic. That’s where SOM comes in.
SOM (Serviceable Obtainable Market) calculation
SOM formula
SOM assumes that you already have an infrastructure in place. Your business model is running; therefore, you have a slice of the pie, a.k.a. a market share.
The SOM formula, including its calculation, is more straightforward than the previous ones. To start with, the formula is as follows:
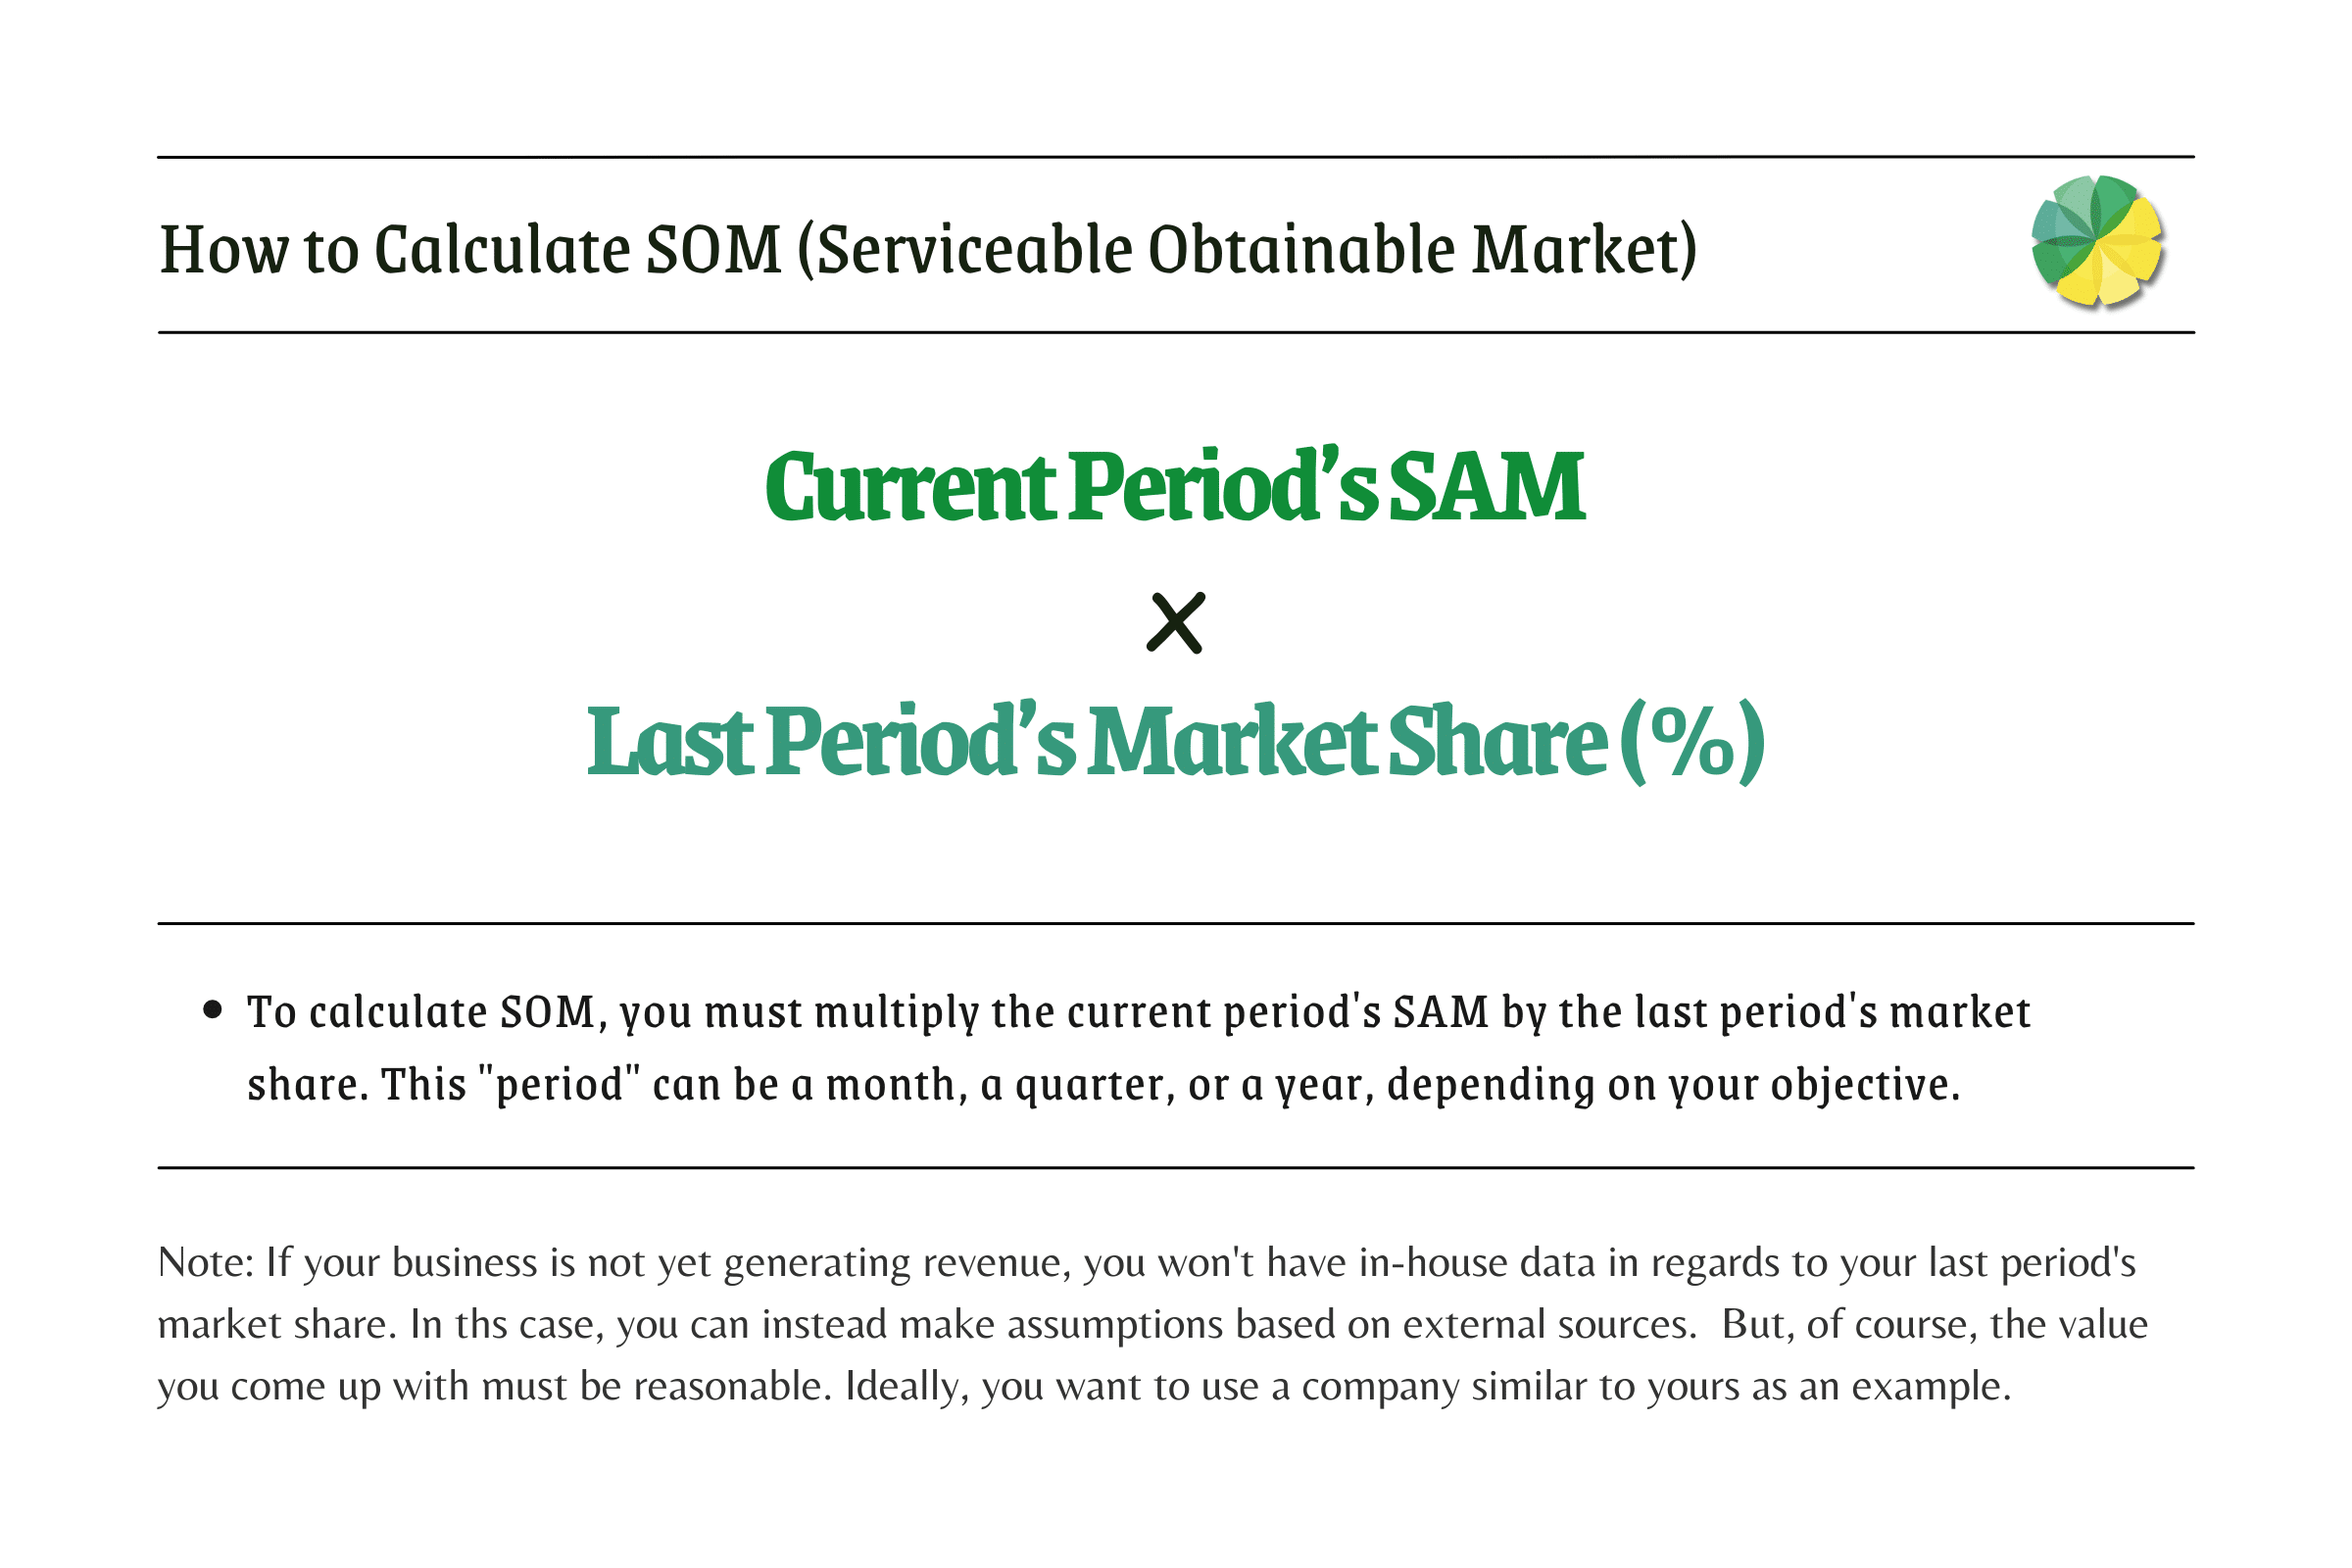
Let’s take a look at what each data entails.
Current period’s SAM
This data corresponds to the SAM, plain and simple.
Last period’s market share (%)
This refers to the market share you could take from the previous period. This can be from last month, last quarter, or last year, though usually, it’s annually.
Market share is a percentage value representing how your revenue compares to the SAM.

Source: TheStreet
Suppose your revenue reached £780 thousand in a year where the SAM was, say, £10 million. Your market share in that period would be as follows:
Market Share (%) = £780,000 / £10,000,000 x 100
Market Share (%) = 0.078 x 100
Market Share (%) = 7.8%
SOM calculation example
Continuing the previous example, you already have half of the necessary data.
As for the market share, you can also get that from in-house data. There’s no need to rely on external sources such as industry reports or case studies.
Let’s assume your app is already out, and your market share in the previous year was 6.41%. In this case, the calculation will be as follows:
SOM = Current Period’s SAM x Last Period’s Market Share (%)
SOM = £15,340,468.80 x 6.41%
SOM = £983,324.05
But what if your business is not yet generating revenue?
In that case, you must use comparable examples as your reference. Suppose there’s a company called CoachFit, and their app is similar to yours.
CoachFit has less than 20 people working on the project and funding of £50k.
Let’s say your app development company has roughly the same number of employees and funding. CoachFit, within its first year of launch, had a market share of 4.83%.
It’s reasonable to assume that you can achieve a market share close to that once your app is out.
Though the formulas are simple, collecting the data can be tough. At some point, you might ask yourself why you need them in the first place.
What is the purpose of TAM SAM SOM?
Starting a business or expanding your market is exciting, especially considering the revenue you can potentially make. However, you must manage your expectations.
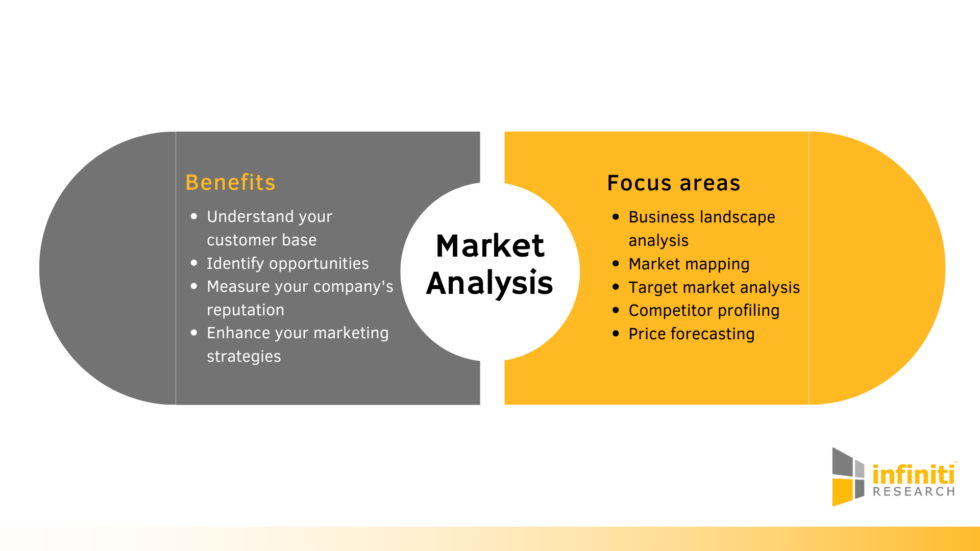
Source: Infiniti Research
TAM SAM SOM are metrics that can help in this regard. Here are several reasons why:
- If the market doesn’t offer a large enough market share, it can be difficult to convince potential investors to support your venture. They allow you to shift your focus to a different market, preferably one with a larger size.
- Likewise, if the market share is too small, you cannot achieve much by expanding your marketing efforts. You may only end up marketing to an audience outside your target market, yielding little to no revenue.
- You may realise that your market offers untapped opportunities. Perhaps the specific needs of consumers in that market are unmet. Maybe there is minimal competition. Either way, this should make it easier to convince investors.
- The employees may burn out if you set an unrealistic revenue goal, not to mention other issues that may follow.
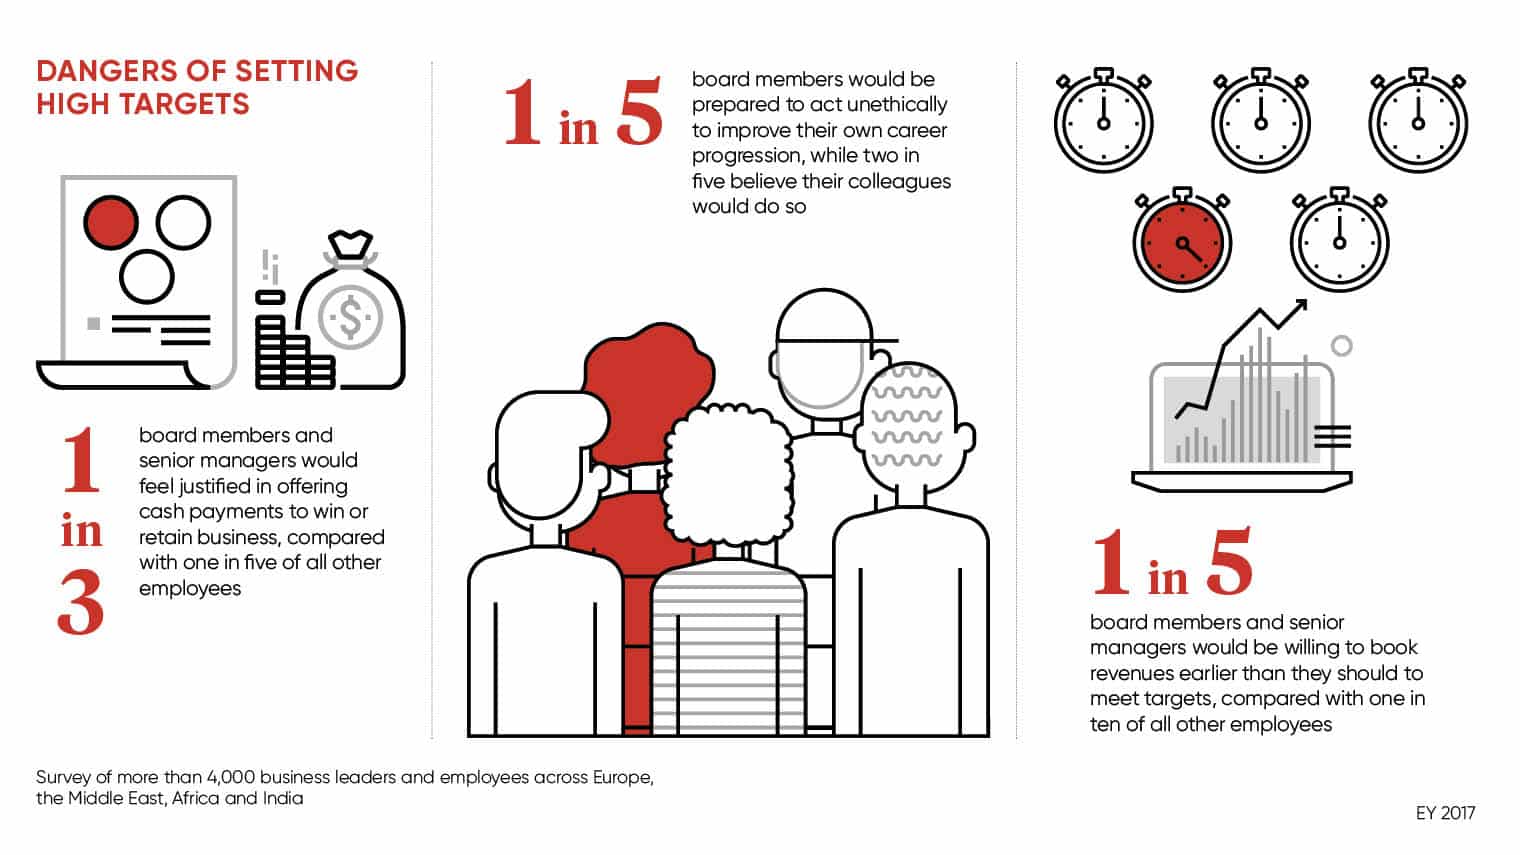
Source: Raconteur
Needless to say, TAM SAM SOM are metrics that would aid in your business strategy.
Closing thoughts on TAM SAM SOM
Most businesses rely heavily on metrics when making decisions. Some are relevant to product managers, and others are not. While especially relevant to sales specialists, TAM SAM SOM also plays a crucial role in product development. In particular, they help you realise a product’s full potential, resulting in confidence in decision-making.
If you’re interested in gamification, it helps to know that the gamification market size is expected to grow to £24.43 billion by 2025. Contact Mambo now to discuss how you can leverage this technology and possibly take a slice of this enormous market.